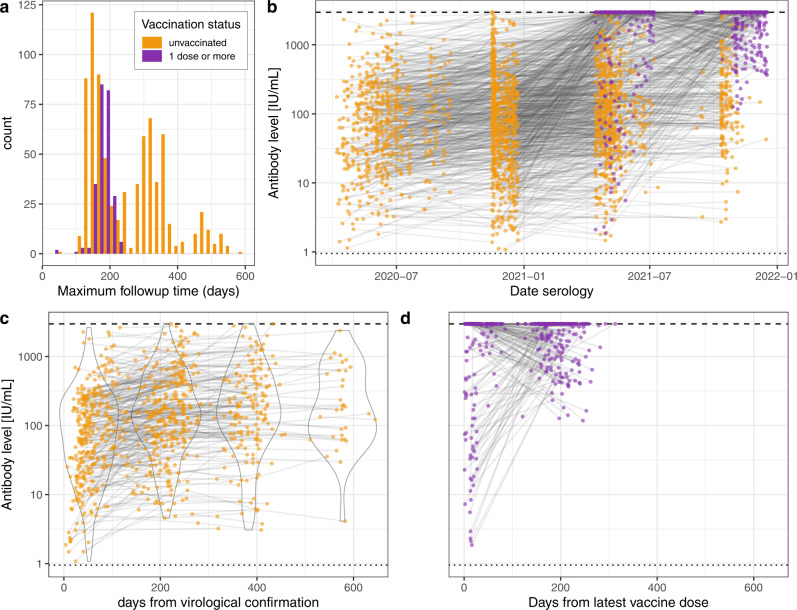
Fig. 2. Anti-S binding antibodies level trajectories.
a Follow-up time distribution (time from participant’s first to last serology) for samples collected prior (n = 778, yellow) and post (n = 246, purple) vaccination when at least two positive samples were available. Note that participants may have multiple samples prior and post vaccination and may therefore appear in both categories. b Trajectories for all participants (n = 1083) by serological sampling date and according to vaccination status. Colors as in panel (a). c Trajectories of pre-vaccination samples by time from virological confirmation when available (n = 442), along with violin plots of antibody levels in discrete arbitrary categories of time post confirmation (0–149, 150–249, 250–449, 450+ days). d Trajectories post-vaccination by time from latest dose (n = 246). Dashed and dotted lines in panels b–d indicate the upper quantification limit (2500 U/mL, equivalent to 2960 IU/mL) and threshold for positivity (0.8 U/mL, equivalent to 0.95 IU/mL) of the test, respectively. Source data are provided as a Source Data file.

