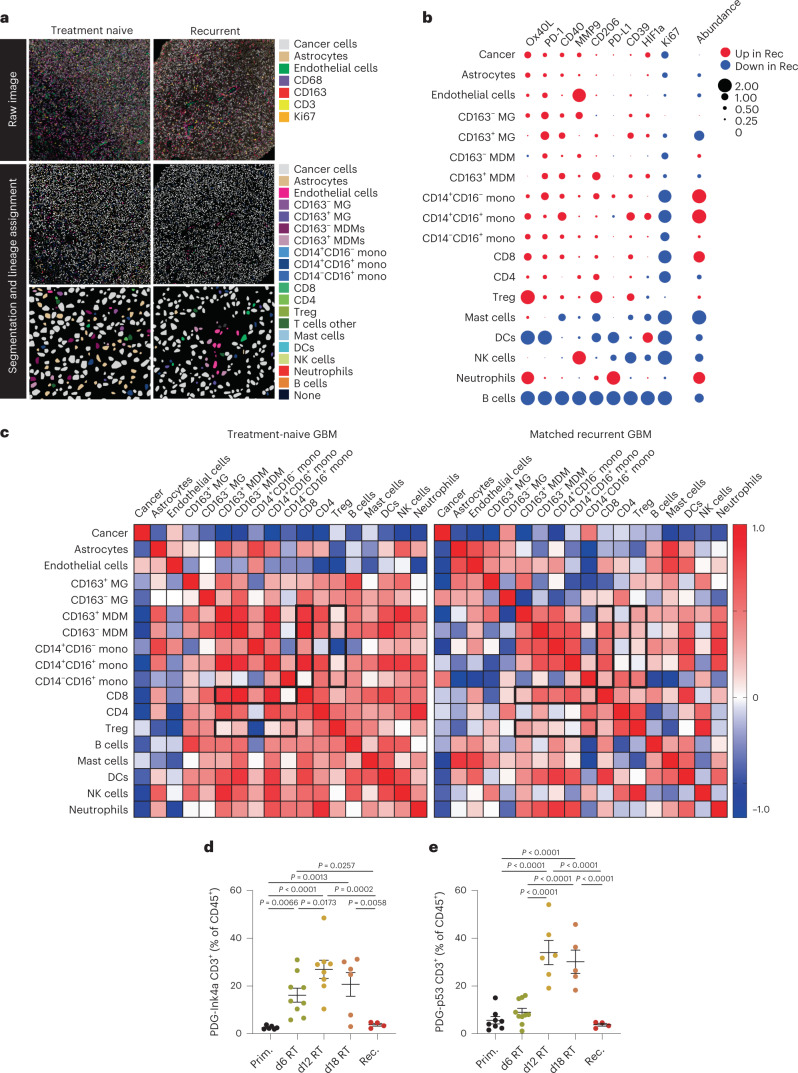
Fig. 1. The glioblastoma microenvironment is highly heterogeneous and T cell scarce.
a, Representative IMC images from treatment-naive human glioblastoma and their matched recurrent tumors post standard of care therapy. Unprocessed images (top) with corresponding processed images with lineage assignment (bottom) are shown, representative of n = 4 independent repeats. b, Bubble plot representing the difference in cell abundance in treatment-naive glioblastoma versus their matched recurrent tumors and the log2 fold change in average signal intensity of the indicated activation markers for each corresponding cell type (n = 4 patients). c, Heat map showing the Spearman correlation between indicated cell types in treatment-naive glioblastoma and their matched recurrent tumors (n = 4 patients). d,e, Flow cytometry quantification of CD3+ T cells (gated from CD45+CD11b− cells) in the tumor microenvironment of PDG-Ink4a/Arf-/- (PDG-Ink4a) (d) and PDG-p53KD (PDG-p53) (e) glioblastoma isolated from primary, treatment-naive tumors (Prim) or from tumors treated with 5x2Gy RT and isolated 6 days, 12 days or 18 days post initial radiation dose (6d, 12d and 18d, respectively), or at tumor regrowth 3–4 weeks post-RT (herein termed recurrence (Rec)) (in d, Prim n = 6, d6 RT n = 9, d12 RT n = 8, d18 RT = 6, Rec n = 4 mice; in e, Prim n = 8, d6 RT n = 10, d12 RT n = 6, d18 RT = 5, Rec n = 5 mice). Statistics: one-way ANOVA with Benjamini, Krieger and Yekutieli correction for multiple testing (d and e). Data are represented as mean ± s.e.m. (d and e).

