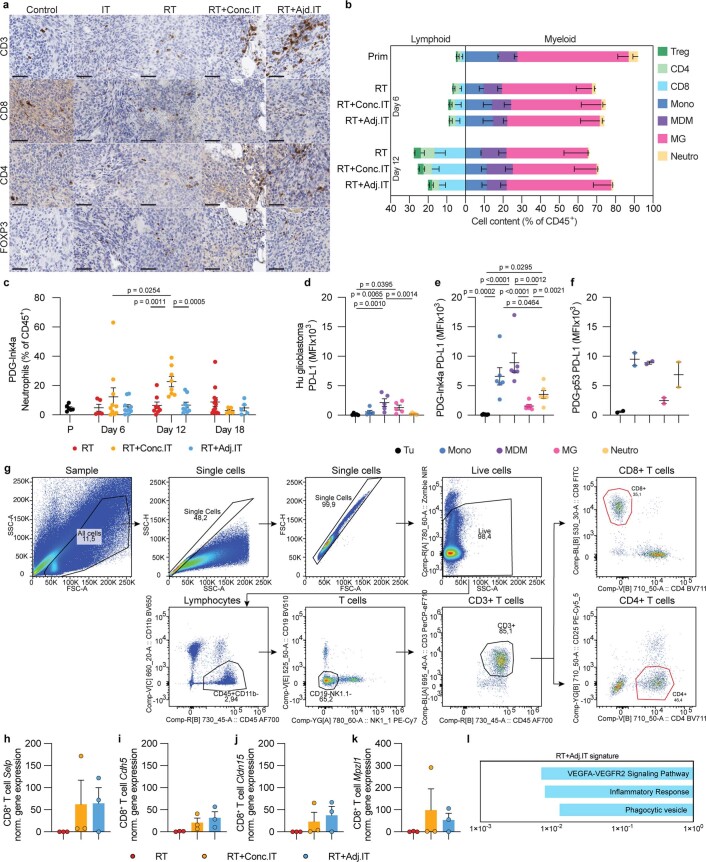
Extended Data Fig. 4. Dynamic changes in the tumor microenvironment in response to RT, RT + Conc.IT and RT + Adj.IT.
a, Representative image of immunohistochemical staining for CD3, CD8, CD4 and FOXP3 on sequential sections of endpoint PDG-Ink4a tumors from cont, RT, IT, RT + Conc.IT and RT + Adj.IT treated mice (scale bar: 50 um; Cont is representative of n = 7, IT is representative of n = 8, RT is representative of n = 16, RT + Conc.IT is representative of n = 24 and RT + Adj.IT is representative of n = 21 independent repeats). b, Relative immune composition of primary (Prim) PDG-p53 glioblastoma as a percentage of CD45+ immune cells. Treg = regulatory T cells, CD8 = CD8+ T cells, CD4 = CD4+ T cells, Mono = Ly6C+ monocytes, MDM = CD49d+ monocyte-derived macrophages, MG = CD49d- microglia, Neutro = Ly6G+ neutrophils (Prim: CD8 n = 4, CD4 n = 8, Treg n = 8, Mono n = 2, MDM n = 2, MG n = 2, Neutro n = 2; d6 RT: CD8 n = 6, CD4 n = 10, Treg n = 10, Mono n = 9, MDM n = 9, MG n = 9, Neutro n = 9; d12 RT: CD8 n = 4, CD4 n = 7, Treg n = 6, Mono n = 3, MDM n = 3, MG n = 3, Neutro n = 3; d6 RT + Conc.IT: CD8 n = 5, CD4 n = 9, Treg n = 9, Mono n = 9, MDM n = 9, MG n = 9, Neutro n = 9; d12 RT + Conc.IT: CD8 n = 9, CD4 n = 8, Treg n = 9, Mono n = 5, MDM n = 5, MG n = 5, Neutro n = 5; d6 RT + Adj.IT: CD8 n = 4, CD4 n = 8, Treg n = 8, Mono n = 9, MDM n = 9, MG n = 9, Neutro n = 9; d12 RT + Adj.IT: CD8 n = 5, CD4 n = 4, Treg n = 5, Mono n = 5, MDM n = 5, MG n = 5, Neutro n = 5). c, Flow cytometry quantification of Ly6G+ neutrophils (gated from CD45+CD11b+Ly6cint) from PDG-Ink4a treated tumors (Prim, RT, RT + Conc.IT or RT + Adj.IT) at the indicated time points post treatment initiation (Prim n = 6, d6 RT n = 5, d12 RT n = 10, d18 RT n = 10, d6 RT + Conc.IT n = 8, d12 RT + Conc.IT n = 8, d18 RT + Conc.IT n = 9, d6 RT + Adj.IT n = 12, d12 RT + Adj.IT n = 5, d18 RT + Adj.IT n = 5 mice). d-f, Flow cytometry quantification of PD-L1 mean fluorescence intensity (MFI) in myeloid cells in the TME of primary human (d), PDG-Ink4a (e) and PDG-p53 (f) glioblastoma. Tu = tumor cells (gated from CD45−CD11b−), Mono = monocytes (gated from CD45+CD11B+CD14+CD16+ (d) or CD45+CD11b+Ly6G−(e,f), MDM = monocyte-derived macrophages (gated from CD45+CD11B+CD14+CD16−CD49D+ (d) or CD45+CD11b+Ly6G−Ly6C−CD49d+ (e,f)), MG = microglia (gated from CD45+CD11B+CD14+CD16−CD49D− (d) or CD45+CD11b+Ly6G−Ly6C−CD49d− (e,f)), Neu = neutrophils (gated from CD45+CD11B+CD66B+ (d) or CD45+CD11b+Ly6G+Ly6Cint (e,f). d, n = 5 patients. e, n = 6 mice. f, n = 2 mice). g, Flow cytometry plots of CD4+ (gated CD45+CD11b−CD3+CD4+) and CD8+ T cell (gated CD45+CD11b−CD3+CD8+) FACS-isolation strategy of d12 RT, RT + Conc.IT and RT + Adj.IT PDG-Ink4a tumors. Sorted cells gated in red. Representative of n = 3 independent repeats. h-k, Normalized expression of indicated genes in CD8+ T cells (gated from CD45+CD11b−CD3+) FACS-purified from PDG-Ink4a tumors 12d post treatment initiation and subjected to RNA sequencing. l, Enriched pathways specific to RT + Adj.IT CD8+ T cells. (Supplementary Table S5). For h-l, RT n = 3, RT + Conc.IT n = 3 and RT + Adj.IT n = 3 mice. Statistics: one-way ANOVA with Benjamini, Krieger and Yekutieli correction for multiple testing (c,h-k) and Fisher’s exact test in combination with the Benjamini-Hochberg method for correction of multiple hypotheses testing (l). Data are represented as mean - S.E.M. (b), ± S.E.M. (c-f) or + S.E.M. (h-k).

