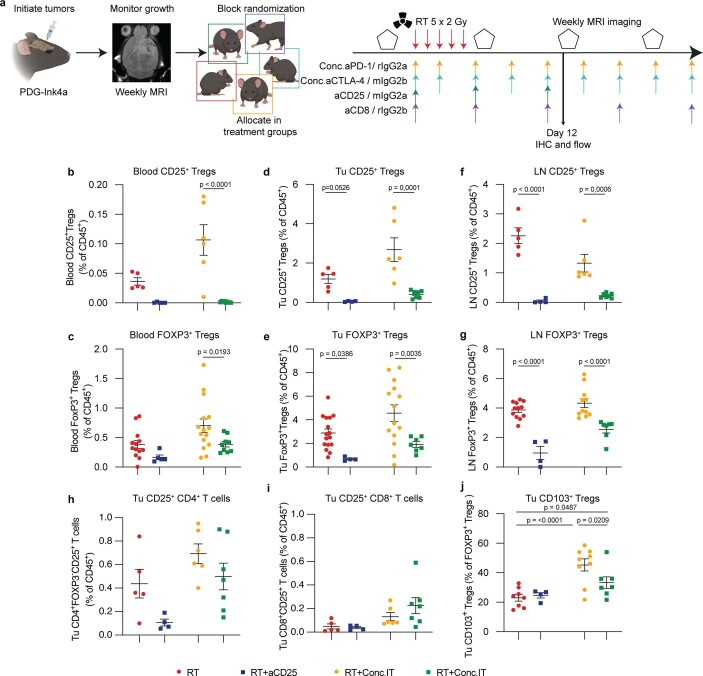
Extended Data Fig. 7. Alterations of the systemic and local immune cell contexture post CD25-mediated depletion of Tregs in glioblastoma combination treatment.
a, Schematic overview of the experimental design. PDG-Ink4a tumors were initiated as described in Methods. At 4-7 weeks post tumor initiation, tumor size was quantified by MRI. Based on tumor volume, mice were distributed into treatment groups with (anti-CD25 (aCD25), anti-CTLA-4 (aCTLA-4), RT, RT combined with anti-CD25 (RT + aCD25), RT + Conc.IT, RT + Conc.IT combined with anti-CD25 (RT + Conc.IT + aCD25), RT + Conc.IT + aCD25 combined with anti-CD8 (RT + Conc.IT + aCD25 + aCD8), RT combined with concurrent anti-CTLA-4 immunotherapy (RT + aCTLA-4), RT + aCTLA-4 combined with anti-CD25 (RT + aCTLA-4 + aCD25). Anti-PD-1 and anti-CTLA-4 treatment were administered every third day until endpoint, anti-CD25 at 0d, 5d and 11d and anti-CD8 treatment every sixth day until endpoint. Mice were followed-up weekly by MRI and sacrificed for immunohistochemical and flow cytometry analysis at d12 post treatment initiation or for survival analysis at humane endpoint or at experimental endpoint (80d). The schematic was created using BioRender.com. b−g, Flow cytometry quantification of CD25+ Tregs (gated from CD45+CD11b−CD3+CD4+FOXP3+ T cells), FOXP3+ Tregs (gated from CD45+CD11b-CD3+CD4+ T cells), CD25+ CD4+FOXP3− T cells (gated from CD45+CD11b−CD3+CD4+FOXP3− T cells) and CD25+ CD8+ T cells (gated from CD45+CD11b−CD3+ T cells) of PDG-Ink4a tumor-bearing mice. b,c, CD25+ Tregs (b) and FOXP3+ Tregs (c) in the blood at d6-7 after treatment start (b: RT n = 5, RT + aCD25 n = 5, RT + Conc.IT n = 6, RT + Conc.IT + aCD25 n = 9 mice. c: RT n = 13, RT + aCD25 n = 5, RT + Conc.IT n = 15, RT + Conc.IT + aCD25 n = 9 mice). d,e, Intratumoral CD25+ Tregs (d) and FOXP3+ Tregs (e) at d12 (d: RT n = 5, RT + aCD25 n = 4, RT + Conc.IT n = 6, RT + Conc.IT + aCD25 n = 7 mice. e: RT n = 16, RT + aCD25 n = 4, RT + Conc.IT n = 14, RT + Conc.IT + aCD25 n = 7 mice). f,g, CD25+ Tregs (f) and FOXP3+ Tregs (g) in the superficial cervical LN at d12 (f: RT n = 5, RT + aCD25 n = 4, RT + Conc.IT n = 6, RT + Conc.IT + aCD25 n = 7 mice. g: RT n = 12, RT + aCD25 n = 4, RT + Conc.IT n = 11, RT + Conc.IT + aCD25 n = 7 mice). h,i, Flow cytometry quantification of intratumoral CD25+ CD4+FOXP3− T cells (h) and CD25+ CD8+ T cells (i) at d12 (h: RT n = 5, RT + aCD25 n = 4, RT + Conc.IT n = 6, RT + Conc.IT + aCD25 n = 7 mice. i: RT n = 5, RT + aCD25 n = 4, RT + Conc.IT n = 6, RT + Conc.IT + aCD25 n = 7 mice). j, Flow cytometry quantification of intratumoral CD103+ Tregs at d12 (RT n = 8, RT + aCD25 n = 4, RT + Conc.IT n = 9, RT + Conc.IT + aCD25 n = 7 mice). For (c,e,g), RT and RT + Conc.IT data points include data from Fig. 3n (e) and Fig. 5b,c (c,g). Statistics: one-way ANOVA with Benjamini, Krieger and Yekutieli correction for multiple testing (b-j). Data are represented as mean ± S.E.M. (b-j).

