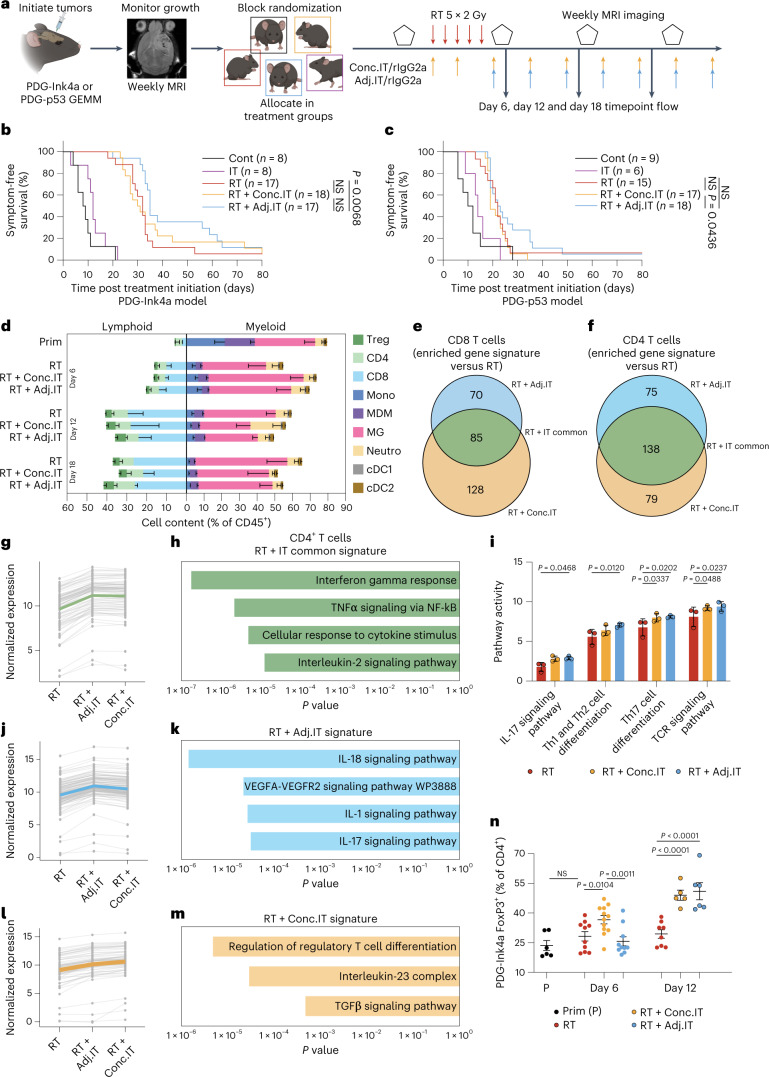
Fig. 3. RT with adjuvant IT leads to a modest therapeutic benefit over concurrent IT in poorly immunogenic glioblastomas.
a, Schematic overview of the experimental design. PDG-Ink4a and PDG-p53 tumors were initiated as described in Methods. At 4–7 weeks post tumor initiation, tumor size was quantified by MRI. On the basis of tumor volume, mice were distributed into treatment groups by block randomization (Cont, RT, IT, RT + Adj.IT or concurrent combination treatment (RT + Conc.IT)), followed up weekly by MRI and killed at 80 days or at humane endpoint. The schematic was created using BioRender.com. b,c, Kaplan–Meier survival curves of PDG-Ink4a-treated (b) and PDG-p53-treated (c) tumor-bearing mice. d, Immune composition of PDG-Ink4a tumors. Prim, primary; Treg, regulatory T cells; CD8, CD8+ T cells; CD4, CD4+ T cells; Mono, Ly6C+ monocytes; MDM, CD49d+ Ms; MG, CD49d− microglia; Neutro, Ly6G+ neutrophils; cDC1, CD24+CD11b− dendritic cells; cDC2, CD24−CD11b+ dendritic cells (Prim: CD8 n = 2, CD4 n = 7, Treg n = 7, Mono n = 6, MDM n = 6, MG n = 6, Neutro n = 6, cDC1 n = 5, cDC2 n = 5; d6 RT: CD8 n = 3, CD4 n = 8, Treg n = 8, Mono n = 7, MDM n = 7, MG n = 7, Neutro n = 7, cDC1 n = 6, cDC2 n = 6; d12 RT: CD8 n = 3, CD4 n = 11, Treg n = 11, Mono n = 11, MDM n = 11, MG n = 11, Neutro n = 11, cDC1 n = 10, cDC2 n = 10; d18 RT: CD8 n = 1, CD4 n = 7, Treg n = 7, Mono n = 6, MDM n = 6, MG n = 6, Neutro n = 6, cDC1 n = 3, cDC2 n = 3 mice; d6 RT + Conc.IT: CD8 n = 5, CD4 n = 10, Treg n = 10, Mono n = 7, MDM n = 7, MG n = 7, Neutro n = 7, cDC1 n = 9, cDC2 n = 9; d12 RT + Conc.IT: CD8 n = 3, CD4 n = 8, Treg n = 8, Mono n = 8, MDM n = 8, MG n = 8, Neutro n = 8, cDC1 n = 7, cDC2 n = 7; d18 RT + Conc.IT: CD8 n = 3, CD4 n = 8, Treg n = 8, Mono n = 5, MDM n = 5, MG n = 5, Neutro n = 5, cDC1 n = 3, cDC2 n = 3; d6 RT + Adj.IT: CD8 n = 3, CD4 n = 9, Treg n = 9, Mono n = 8, MDM n = 8, MG n = 8, Neutro n = 8, cDC1 n = 6, cDC2 n = 6; d12 RT + Adj.IT: CD8 n = 3, CD4 n = 9, Treg n = 9, Mono n = 9, MDM n = 9, MG n = 9, Neutro n = 9, cDC1 n = 10, cDC2 n = 10; d18 RT + Adj.IT: CD8 n = 2, CD4 n = 7, Treg n = 7, Mono n = 5, MDM n = 5, MG n = 5, Neutro n = 5, cDC1 n = 3, cDC2 n = 3). e,f, Venn diagram depicting the genes enriched in CD8+ (e) and CD4+ (f) T cells FACS-purified from d12 RT + Conc.IT and RT + Adj.IT versus RT PDG-Ink4a glioblastoma subjected to RNA-seq (Supplementary Table 2). g, Line charts displaying the normalized gene expression of the RT + IT common gene signatures in CD4+ T cells with each dot representing a gene, and lines connecting the same gene across treatment groups. Colored lines are the average of the whole gene signature (Supplementary Tables 2 and 6). h, Bar plots showing the adjusted P value of relevant significantly enriched gene sets in the RT + IT common gene signature from g (Supplementary Table 6). i, Bar plots depicting the GAGE81 gene set activity in CD4+ T cells for RT, RT + Conc.IT and RT + Adj.IT treatment groups. j, Line charts as described in g displaying the normalized gene expression of the RT + Adj.IT gene signatures in CD4+ T cells (Supplementary Tables 2 and 7). k, Bar plot showing the adjusted P value of relevant significantly enriched pathways in the RT + Adj.IT gene signature from j (Supplementary Table 7). l, Line charts as described in g displaying the normalized gene expression of the RT + Conc.IT gene signatures in CD4+ T cells (Supplementary Tables 2 and 8). m, Bar plot showing the adjusted P value of relevant significantly enriched pathways in the RT + Conc.IT gene signature from l (Supplementary Table 8). For e–m, CD4+ and CD8+ RT n = 3, CD4+ and CD8+ RT + Conc.IT n = 3, CD4+ and CD8+ RT + Adj.IT n = 3 mice. n, Flow cytometry quantification of FOXP3+ Tregs (gated from CD45+CD11b−CD3+CD4+ T cells) in the TME of PDG-Ink4a glioblastoma post treatment (Prim n = 6, d6 RT n = 10, d12 RT n = 12, d6 RT + Conc.IT n = 10, d12 RT + Conc.IT n = 8, d6 RT + Adj.IT n = 5, d12 RT + Adj.IT n = 6 mice). Statistics: Fisher’s exact test in combination with the Benjamini–Hochberg method for correction of multiple hypotheses testing (two-sided; h, k and m; Supplementary Tables 6–8) and one-way ANOVA with Benjamini, Krieger and Yekutieli correction for multiple testing (i and n). Data are shown as mean − s.e.m. (d), mean + s.e.m. (i) or mean ± s.e.m. (n). NS, not significant. Median survival and significance depicted in Supplementary Table 1 (b and c).

