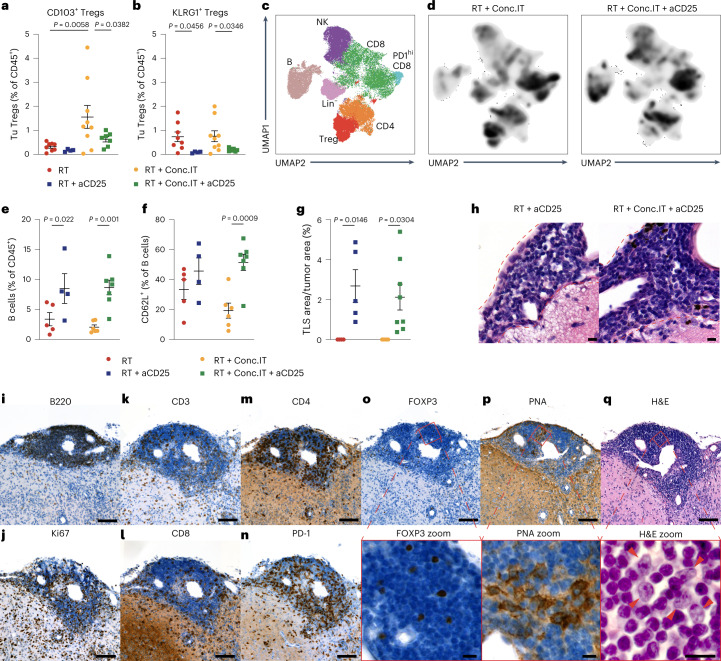
Fig. 5. Targeting CD25+ regulatory T cells results in the formation of TLS in glioblastoma.
a,b, Flow cytometry quantification of CD103+ Tregs (a) and KLRG1+ (b) Tregs in PDG-Ink4a tumors (Tu, tumor; for treatment schedule, see Extended Data Fig. 7a). RT and RT + Conc.IT data points are from Fig. 4d supplemented with three additional data points per treatment group (RT n = 8, RT + aCD25 n = 4, RT + Conc.IT n = 9, RT + Conc.IT + aCD25 n = 7 mice). c,d, UMAP projections and unsupervised FlowSOM clustering analysis of CD45+CD11b− cells isolated from PDG-Ink4a tumors identified seven main populations: B, B cells; NK, NK cells; CD8, CD8+ T cells; PD-1hiCD8, CD8+ T cells with high PD-1 expression; Treg, regulatory T cells; CD4, CD4+ T cells; Lin−, cells negative for lineage markers (RT n = 5, RT + aCD25 n = 4, RT + Conc.IT n = 6, RT + Conc.IT + aCD25 n = 7 mice). d, Density projection plots from c of RT + Conc.IT and RT + Conc.IT + aCD25 treatment groups. e,f, Flow cytometry quantification of CD19+ B cells (e) (gated from CD45+CD11b+CD3) and CD62L+ cells (f) (% of CD19+ B cells from e; RT n = 8, RT + aCD25 n = 4, RT + Conc.IT n = 8, RT + Conc.IT + aCD25 n = 7 mice). g, Quantification of TLS area as a percentage of total tumor area in the different treatment groups (RT n = 4, RT + aCD25 n = 5, RT + Conc.IT n = 4, RT + Conc.IT + aCD25 n = 8 mice). h, Representative H&E staining of TLS quantified in g (scale bars, 10 µm; representative of n = 8 independent repeats). i–q, Representative image of a TLS in RT + Conc.IT + aCD25-treated PDG-Ink4a tumor sequentially stained for B220 (i), Ki67 (j), CD3 (k), CD8 (l), CD4 (m), PD-1 (n), FOXP3 (o), PNA (p) and H&E (q). Red squares (o–q) indicate magnified areas. Red arrows (q) identify lymphoblastic-like cells within the TLS. Scale bars, 100 µm for the main and 10 µm for the magnified panels (i–q). Representative of n = 8 independent repeats. For all graphs, analyses were done at d12 post treatment initiation on the tumor-containing brain quadrant. Statistics: one-way ANOVA with Benjamini, Krieger and Yekutieli correction for multiple testing (a, b and e–g). Data are represented as mean ± s.e.m. (a, b and e–g).

