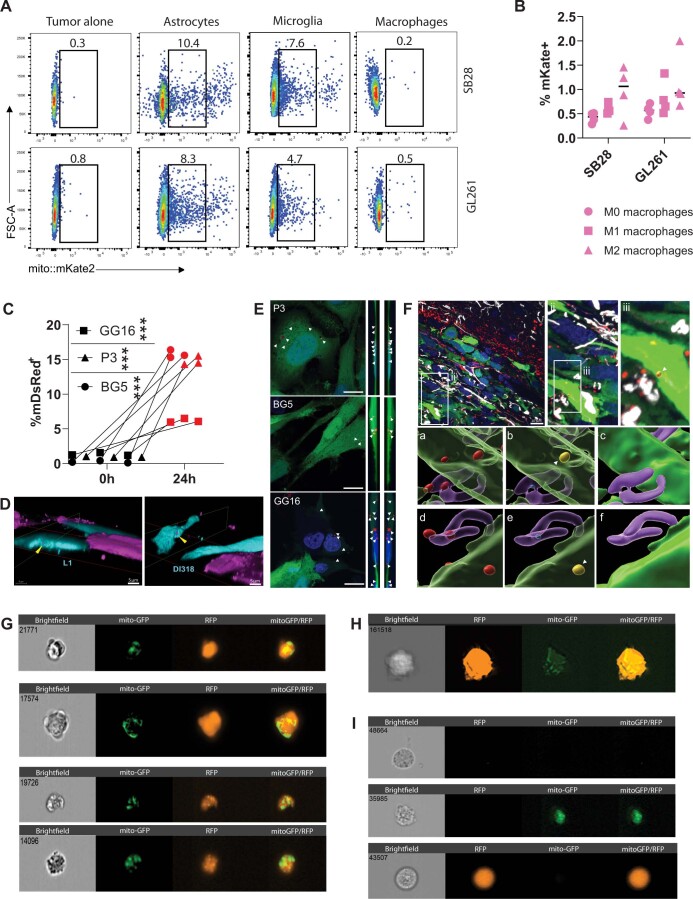
Extended Data Fig. 4. Additional data for in vitro mitochondria transfer in mouse and diverse patient-derived GBM models.
(A) Representative flow cytometry dot plots depicting mitochondria transfer frequency to mouse GBM cells from mito::mKate2 donor cells, summarized in Fig. 2B. (B) Mitochondria transfer from polarized (M1, M2) or non-polirized (M0) bone marrow-derived macrophages, assessed by flow cytometry. n = 4 independent experiments. Two-way ANOVA. (C) Flow cytometry of mitochondria transfer between mDsRed+ astrocytes and P3/BG5/GG16 GFP + cells at 24 h; mean ± SD. n = 3 independent experiments. *** p < 0.0001 (2-tailed t-test). (D) 3D reconstructions of confocal microscopy from patient-derived GBM and astrocyte co-cultures. mito-mCherry astrocytes (magenta); cyan cells CellTrace-labelled GSCs (cyan). Perpendicular cutaway planes (red and green outlines) reveal internalized astrocyte-derived mito-mCherry+ mitochondria in GSCs (yellow arrowheads). (E) Confocal microscopy of mitochondria transfer in P3/BG5/GG16 GFP + cells with mDsRed+ astrocyte mitochondria (arrows); representative of at least four 100x images across 3 biologically independent animals for each cell line. Scale bars 10 mm. Z stack locates mDsRed+ mitochondria (arrows) within acceptor cell cytoplasm, from the left side (i) and the right (ii). (F) Mitochondria transfer between astrocytes (mitoDsRed+GFAP+) and human GBM cells (GFP+) in vivo. Confocal microscopy of GFP+ P3 xenograft tumor immunostained for GFAP (white) to visualize astrocytes; representative of at least six 100X images across 3 biologically independent animals. (i) Mitochondria transfer highlighted at invasive tumor area with colocalization of GFP + and mitoDsRed+ signal (ii and iii, higher magnification). 3D reconstruction of the mitoDsRed+ mitochondrial signal within and around GFP + and GFAP + surfaces (a). mitoDsRed+ mitochondria colocalize within GFP + tumor cells (yellow) and within the purple reconstructed GFAP + astrocytic processes (blue), seen from above without (b) and with (c) GFP + and GFAP + cell borders. From below, mitoDsRed+ mitochondria are also visible (d) and reside within the GFP + and GFAP + regions (e-f). Scale bars 10 µm. (G-H) ImageStream depicting transferred mito-GFP astrocyte mitochondria to co-cultured (G) D456 and (H) JX22 patient-derived RFP+ GBM cells, representative across >imaged 100 cells per cell type and model. (I) Single-cell culture controls demonstrating the specificity of the RFP (tumor) and GFP (astrocyte mitochondria) signals. Top to bottom: Non-transduced GBM cells; mito-GFP astrocytes; RFP GBM cells.

