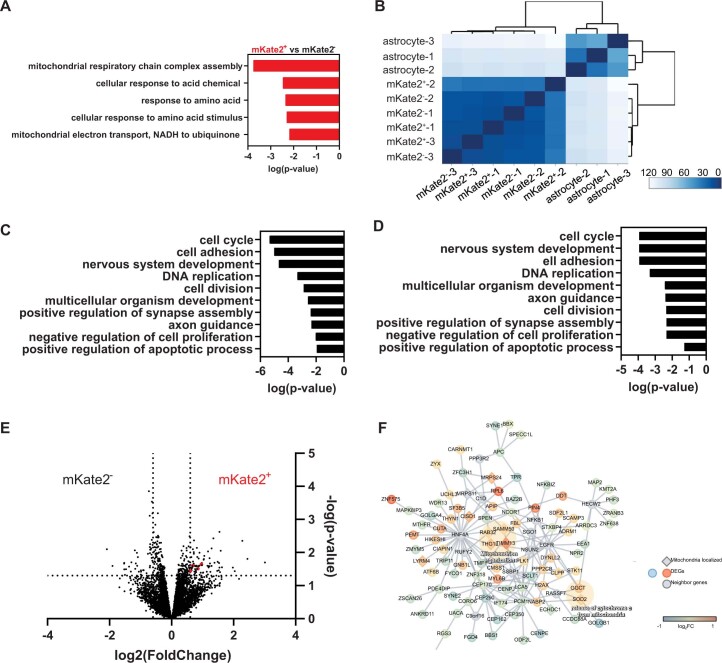
Extended Data Fig. 7. Mitochondria transfer alters expression of metabolism gene pathways in recipient GBM cells.
(A-F) RNAseq analysis from n = 3 independent co-culture experiments. (A) Top 5 pathways enriched in RNAseq data from sorted mKate2+ versus mKate2−SB28 cells based on genes upregulated >1.5 fold with p < 0.05 (one-tailed hypergeometric enrichment test, unadjusted p-values). (B-D) Data supporting purity of sorted cell populations in RNAseq experiments, given distinct transcriptomic signature of sorted astrocytes vs. GBM cells. (B) Heatmap demonstrating separate unsupervised hierarchical clustering of astrocytes from mKate2− and mKate2+ tumor cells based on gene expression profiling. GO pathway analysis of differentially expressed genes between (C) mKate2− cells and astrocytes and (D) mKate2+ cells and astrocytes. One-tailed hypergeometric enrichment test, unadjusted p-values. (E) Volcano plot representing differential gene expression signature of mKate2+ versus mKate2− cells. Dashed lines mark fold change > 1.5 and p-value < 0.05. Negative binomial distribution DESeq2 testing, unadjusted p-value. Genes that are mapped to mitochondria-related networks are shown in red. (F) Differentially up-regulated genes are enriched in the mitochondrial network. Protein-protein interaction network for the differentially expressed genes. Mouse genes were mapped to human genes according to NCBI HomoloGene. Protein-protein interactions were extracted for these genes/proteins using our human protein interactome. Diamond-shaped nodes indicate that these genes are mitochondrially localized based on the Human MitoCarta2.0 database. Node color shows the log2 fold change of the genes.

