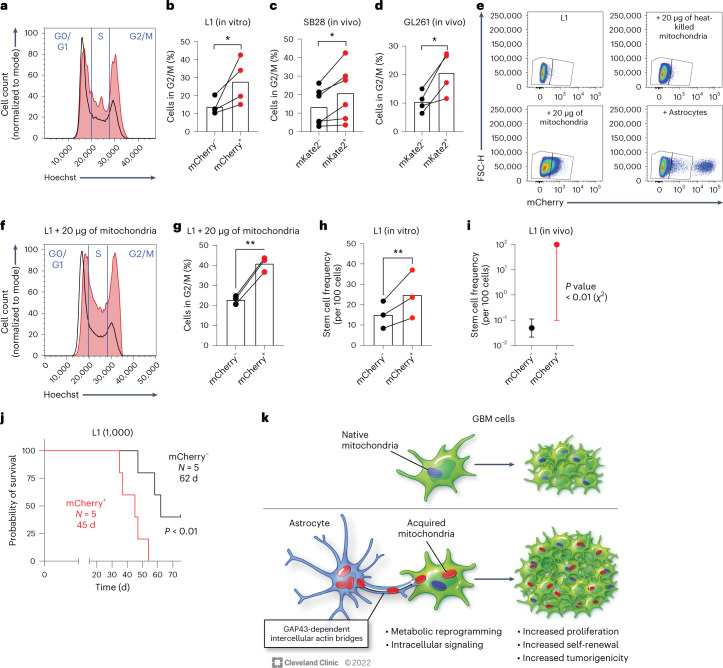
Fig. 7. Mitochondria transfer from astrocytes drives GBM cell proliferation, self-renewal and tumorigenicity.
a,b, Human-derived GSCs (L1) were cocultured with immortalized mito-mCherry+ human astrocytes. Representative histograms (a) and aggregate data (b) of n = 4 independent experiments depicting cell cycle analysis by flow cytometric DNA quantification in GSCs that acquired astrocyte mitochondria (mCherry+, red histogram/dots) versus those that did not (mCherry–, black histogram/dots) are shown; *P = 0.04. Data were analyzed by two-tailed t-test. c,d, Cell cycle analysis by ex vivo flow cytometry DNA quantification in GFP-expressing mouse GBM cells obtained from orthotopic tumors in mito::mKate2 mice; n = 4–6 mice per tumor model and N = 6 (SB28; c) and 4 (GL261; d) mice per group; *P = 0.02 (SB28) and 0.03 (GL261). Data were analyzed by two-tailed paired t-test. e–g, Cell-free mito-mCherry+ astrocyte mitochondria (intact or heat killed) were added to an L1 culture; vehicle (PBS) or live mito-mCherry+ astrocytes were added to control wells. e, Representative dot plots depicting the identification of L1 cells that acquired cell-free mitochondria or mitochondria from cocultured astrocytes. In the +astrocyte condition, the mCherryhi population outside of the gates is composed of the mito-mCherry+ astrocytes. Representative histograms (f) and aggregate data (g) depicting cell cycle analysis of GSCs that acquired cell-free astrocyte mitochondria (mCherry+, red histogram/dots) versus those that did not (mCherry–, black histogram/dots) are shown; n = 3 independent experiments; **P = 0.003. Data were analyzed by two-tailed paired t-test. h,i, Estimated stem cell frequency in mCherry+ versus mCherry– human-derived GBM models sorted from astrocyte co-cultures and subjected to in vitro limiting dilution sphere formation assay (h) or in vivo orthotopic tumor initiation assay (i); **P = 0.002, ratio paired t-test, n = 3 independent experiments (h); P = 0.005; compiled data from n = 15 NOD scid gamma (NSG) mice per group (distributed across three cell-dose levels). Data are shown as mean ± 95% confidence interval; χ2 test with 1 degree of freedom analyzed by Extreme Limiting Dilution Analysis (ELDA; i). j, Survival of mice injected orthotopically with 1,000 sorted L1 GSCs per animal; P = 0.009. Data were analyzed by log-rank test. Survival analysis of other dose levels is presented in Extended Data Fig. 8. k, Schematic overview of findings.

