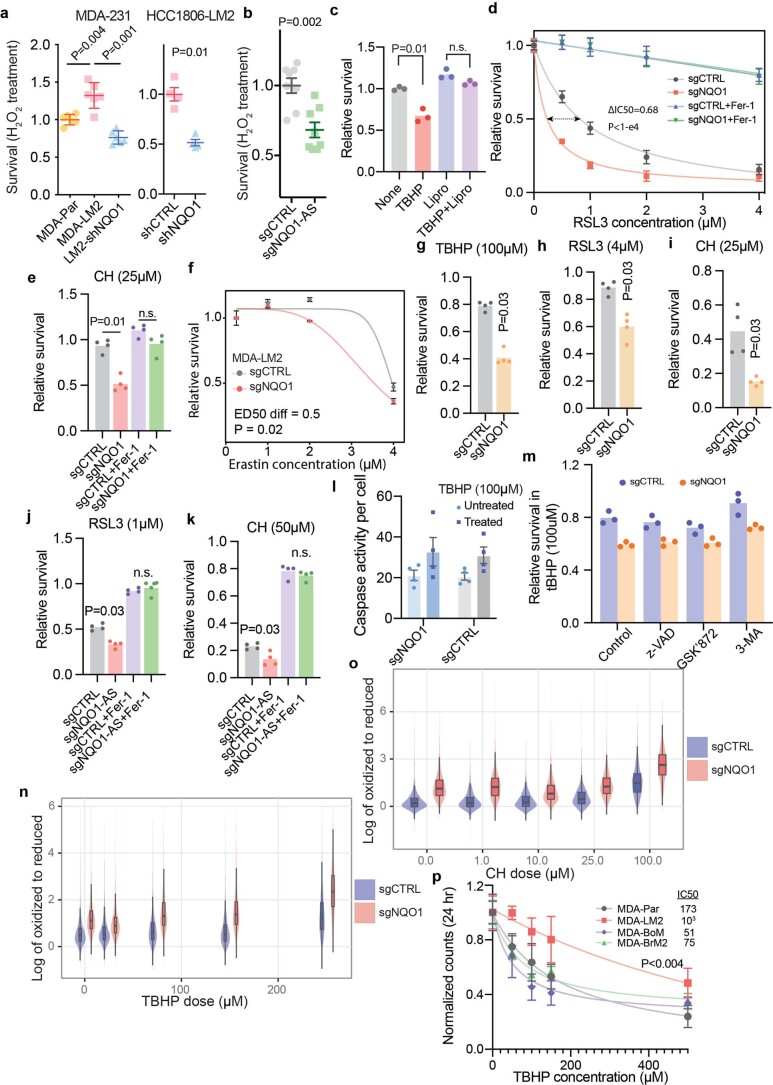
Extended Data Fig. 6. NQO1 protects cancer cells from ferroptosis.
(a) Relative survival of MDA-Par, MDA-LM2, and shRNA-mediated NQO1 knockdown MDA-LM2 cells after treatment with H2O2 (N = 6 independently treated cell cultures), and relative survival of HCC1806-LM2 control and shRNA-mediated NQO1 knockdown cells after treatment with H2O2 (N = 4 independently treated cell cultures). (b) Relative survival of control and CRISPRi-mediated NQO1-AS knockdown MDA-LM2 cells after treatment with H2O2. N = 8 independently treated cell cultures. (c) Relative survival of MDA-LM2 NQO1 knockdown cells after TBHP treatment, with and without pretreatment with liproxstatin-1. N = 3 independently treated cell cultures. (d) RSL3 dose-response in MDA-LM2 NQO1 knockdown and control cells, with and without pretreatment with ferrostatin-1. N = 3 independently treated cell cultures. (e) Relative survival of MDA-LM2 NQO1 knockdown and control cells after cumene hydroperoxide treatment, with and without pretreatment with ferrostatin-1. N = 4 independently treated cell cultures. (f) Erastin dose-response in MDA-LM2 NQO1 knockdown and control cells. N = 3 independently treated cell cultures. (g) Relative survival of HCC1806-LM2 NQO1 knockdown and control cells after TBHP treatment. N = 4 independently treated cell cultures. (h) Relative survival of HCC1806-LM2 NQO1 knockdown and control cells after RSL3 treatment. N = 4 independently treated cell cultures. (i) Relative survival of HCC1806-LM2 NQO1 knockdown and control cells after cumene hydroperoxide treatment. N = 4 independently treated cell cultures. (j) Relative survival of MDA-LM2 NQO1-AS knockdown and control cells after RSL3 treatment, with and without ferrostatin-1 pretreatment. N = 4 independently treated cell cultures. (k) Relative survival of MDA-LM2 NQO1-AS knockdown and control cells after cumene hydroperoxide treatment, with and without pretreatment with ferrostatin-1. N = 4 independently treated cell cultures. (l) Relative caspase activity in TBHP treated and untreated NQO1 knockdown and control MDA-LM2 cells, measured using the Caspase Glo 3/7 Assay System from Promega. N = 4 independently treated cell cultures. (m) Relative survival of MDA-LM2 NQO1 knockdown and control cells after treatment with TBHP, with or without pretreatment with z-VAD, GSK’872, or 3-MDA. N = 3 independently treated cell cultures. (n) Lipid oxidation measurement in MDA-LM2 NQO1 knockdown and control cells after TBHP treatment and staining with C11-BODIPY dye. P < 10-16. N = 3 independently treated cell cultures. (o) Lipid oxidation measurement in MDA-LM2 NQO1 knockdown and control cells after cumene hydroperoxide treatment and staining with C11-BODIPY dye. P < 10-16. N = 3 independently treated cell cultures. (p) TBHP dose-response in MDA, MDA-LM2, MDA-BoM, and MDA-BrM2 cells. Data are presented as mean ± SD. N = 3 independently treated cell cultures. Data in (a), (b) and (l) are presented as mean ± SEM. Data in (d), (f), and (p) are represented as mean ± SD. Box plots in (n) and (o) represent median value and quartiles, whiskers represent 1.5 x IQR. The P values in (a), (b), (e), (g), (h), (i), (j), and (k) were calculated using one-tailed Mann-Whitney U tests. The P values in (c) were calculated using a two-tailed t-test. The P value in (d) was calculated using two-way ANOVA. The P value in (f) was calculated using the drc package in R. The P value in (p) was calculated using 2-way ANOVA.

