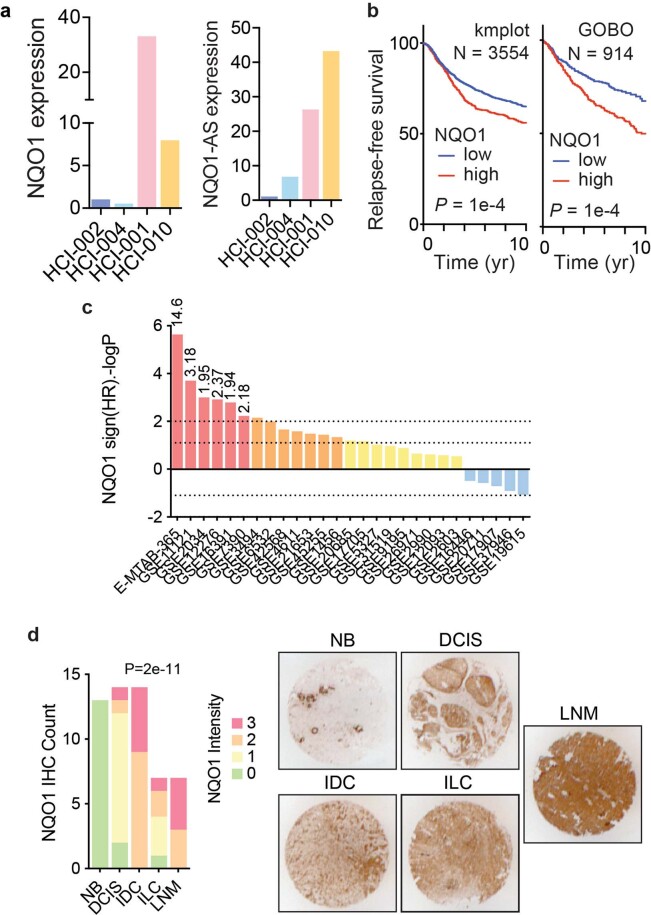
Extended Data Fig. 8. NQO1-AS and NQO1 expression are associated with metastasis in clinical samples.
(a) Relative NQO1 (left) and NQO1-AS (right) expression in 4 patient-derived xenograft lines as measured by RNA-seq. (b) Kaplan-Meier curve showing relative relapse free survival of patients with tumors expressing high and low levels of NQO1 from kmplot (left, N = 3554 patients) and GOBO (right, N = 914 patients) databases. (c) Distribution of 10-year relapse-free survival P values (two-sided log rank test results reported as –logP for positive association and logP for negative) for the correlation of NQO1 expression and clinical outcome in the listed breast cancer datasets. Red bars show associations that pass the statistical threshold, orange bars are trending positive, and blue bars are trending negative. For statistically significant datasets, the hazard ratio is included at the top of the bar. (d) Immunohistochemical staining of NQO1 in a tissue microarray containing non-neoplastic breast tissue (NB), ductal carcinoma in situ (DCIS), invasive ductal carcinoma (IDC), invasive lobular carcinoma (ILC), and lymph node metastases (LNM). The experiment was performed once using 56 sections across stages of breast cancer progression. Blinded grading of the stain intensity is represented by the bar graph on the left. Representative images of stained specimens 3 mm in diameter are shown on the right. The P values in (b) were calculated using log rank tests. The P value in (d) was calculated using a χ2 test.

