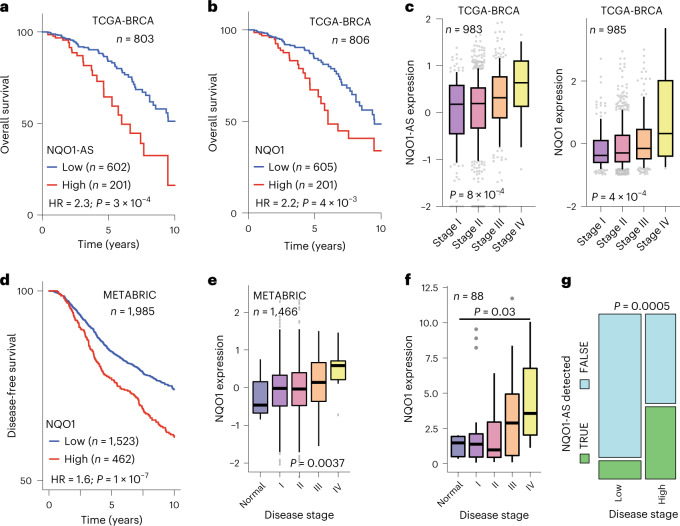
Fig. 8. NQO1-AS and NQO1 expression are associated with metastasis in clinical samples.
a, Kaplan–Meier curve showing the survival rates of patients with tumors expressing high or low levels of NQO1-AS. Data are from the TCGA-BRCA cohort. n = 803 patients per group. b, Kaplan–Meier curve showing the survival rates of patients with tumors expressing high or low levels of NQO1. Data are from the TCGA-BRCA cohort. n = 806 patients per group. c, NQO1-AS and NQO1 expression in tumors associated with stages I, II, III and IV of breast cancer. Data are from the TCGA-BRCA cohort. n = 983 patients (NQO1-AS). n = 985 patients (NQO1). d, Kaplan–Meier curve showing the disease-free survival of patients with tumors expressing high or low levels of NQO1. Data are from METABRIC. n = 1,985 patients per group. e, NQO1 expression in normal cells and cells associated with stages I, II, III and IV of breast cancer. Data are from METABRIC. n = 1,466 patients per group. f, NQO1 expression in normal cells and cells associated with stages I, II, III and IV of breast cancer. Data are from BCRT102 and BCRT103. n = 88 independent tissue samples. g, Graph showing the fraction of tumors with detectable NQO1-AS in low-stage and high-stage breast cancer. The width of the bars is proportional to the number of samples that fall into each group. Data are from the Origene Tissue Scan (BCRT102 and BCRT103). n = 88 independent tissue samples. The boxplots in c,e,f represent the median values and quartiles, while the whiskers represent the deciles. The P values in a,b,d were calculated using log-rank tests. The P values in c,e were calculated using an ANOVA. The P value in f was calculated using a two-tailed Mann–Whitney U-test. The P value in g was calculated using a chi-squared test.

