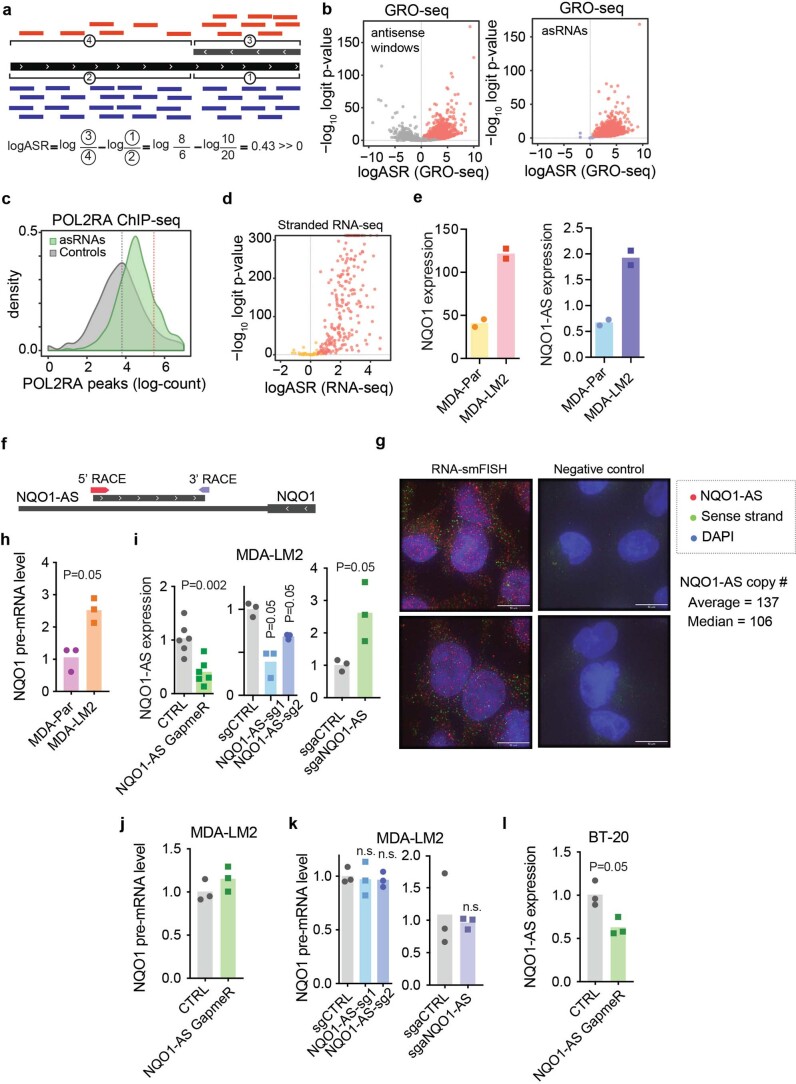
Extended Data Fig. 1. Discovery and annotation of antisense RNAs.
(a) Schematic showing sense and antisense read distribution in IRIS and the calculation of logASR. (b) Volcano plots showing windows of high antisense activity (left) and annotated asRNAs (right) based on GRO-seq data. (c) Prevalence of asRNAs and negative controls in POL2RA ChIP-seq data from ENCODE. Red line represents threshold above which there is strong evidence for RNA Pol II binding across multiple cell lines. (d) Volcano plot showing logASR distribution from stranded RNA-seq in MDA-Par and MDA-LM2 cells. (e) Relative NQO1 (left) and NQO1-AS (right) expression in MDA-Par and MDA-LM2 cells measured by RNA seq (TPM). N = 2 independent cell cultures. (f) Tracks indicating the 5’ (red) and 3’ (purple) ends of NQO1-AS, as identified by 5’ and 3’ RACE, respectively. (g) Representative images from RNA-smFISH in MDA-LM2 cells, using probes targeted to NQO1-AS (red) and NQO1 (green). (h) Relative NQO1 pre-mRNA level in MDA-Par and MDA-LM2 cells measured by qPCR. N = 3 independent cell cultures. (i) Relative NQO1-AS expression in MDA-LM2 cells with GapmeR-mediated NQO1-AS knockdown (N = 6 independent cell cultures), CRISPRi-mediated NQO1-AS knockdown (N = 3 independent cell cultures), and CRISPRa-mediated NQO1-AS overexpression (N = 3 independent cell cultures), measured by qRT-PCR. (j) Relative NQO1 pre-mRNA level in MDA-LM2 cells with Gapmer-mediated NQO1-AS knockdown, measured by qRT-PCR. N = 3 independent cell cultures. (k) Relative NQO1 pre-mRNA level in MDA-LM2 cells with CRISPRi-mediated NQO1-AS knockdown and CRISPRa-mediated NQO1-AS overexpression, measured by qRT-PCR. N = 3 independent cell cultures. (l) Relative NQO1-AS expression in BT-20 cells with GapmeR-mediated NQO1-AS knockdown, measured by qRT-PCR. N = 3 independent cell cultures. All P values were calculated using one tailed Mann-Whitney U tests.

