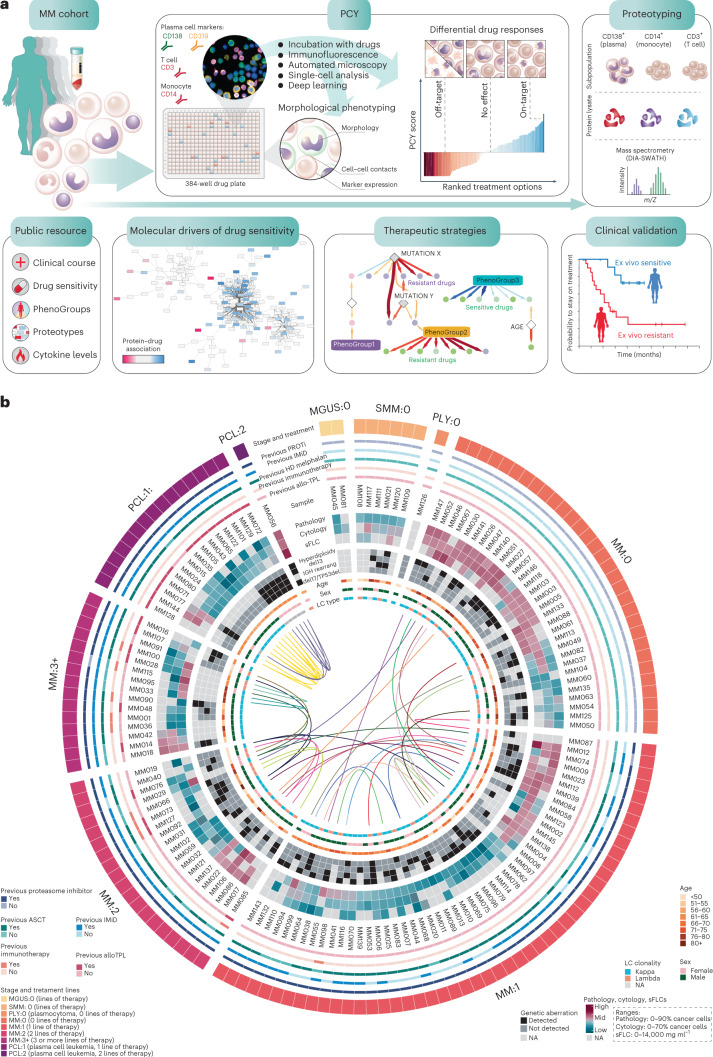
Fig. 1. Workflow and cohort details for the integrative functional, molecular and clinical analysis of patients with MM.
a, Schematic indicating the study workflow and derived results. Data are available as described in the Data Availability section, as well as at https://myelomics.com. b, Circos plot representing the multiple myeloma cohort and samples collected during the observational clinical study. A total of 138 patient samples from 89 unique patients are shown, with the follow-up samples from recurring patients connected with the lines in the inner part of the circos plot (unique color per patient). sFLC, serum-free light chain; NA, not available. For further details see legend, Extended Data Fig. 1 and Supplementary Table 1.

