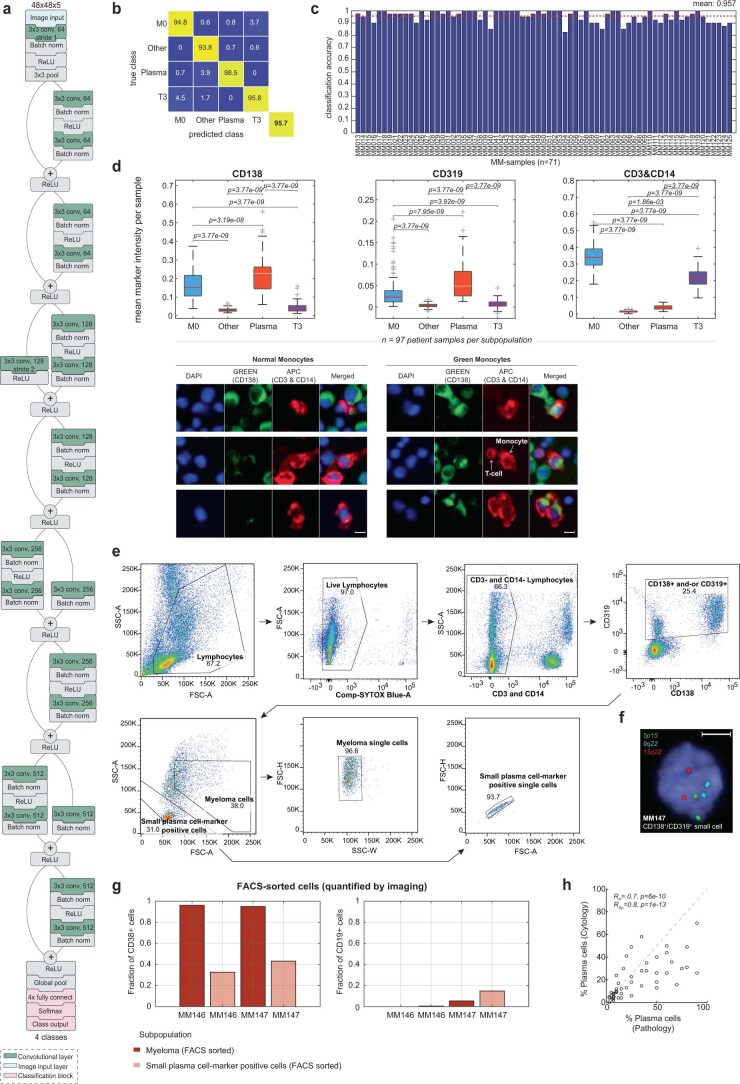
Extended Data Fig. 2. Single-cell image analysis of primary myeloma samples.
a, Convolutional neural network architecture (ResNet) of the 4-class classifier used in the study to classify each imaged cell into either a monocyte, plasma cell, T cell, or other cell class. b, Confusion matrix showing the ResNet classification accuracy on cells from 71 samples used in the training set, calculated on cells that were not part of the CNN training data. Overall classification accuracy across the training samples was 95.7%, with the highest accuracy for the plasma cell class (98.5% accuracy). c, Overall classification accuracy per patient sample, calculated on cells that were not part of the CNN training data (n = 71 samples). Red dashed line indicates average accuracy across all samples. d, Boxplots of mean marker intensities per sample (n = 97 patient samples) of each respective subpopulation marker (n = 1260 cells on average per subpopulation and marker and sample). Boxplots as in Fig. 2c. P-values calculated by unpaired two-tailed Student’s t-test. d, below, Image examples of normal and green monocytes. Scale bar: 10 μm. e, Exemplary FACS-gating for sorting of myeloma and small plasma cell-marker-positive cells. First, FSC-A and SSC-A gates are used to select the lymphocytes that are further enriched in viable cells. CD14 and CD3 cells are excluded, and only plasma cell-marker (CD138 and/or CD319) positive cells are kept. Finally, plasma cell-marker-positive cells are separated based on SSC-A and FSC-A gates into big cells (myeloma cells) and small plasma cell-marker-positive cells. Singlets of each subpopulation are chosen and sorted out for further downstream processing. f, Example FISH-image of a small plasma cell-marker-positive cell of MM147 sample, showing normal chromosomal copy numbers (diploidy) for the tested probes. Picture is representative of 100 cells analyzed for this sample and class, see quantification in Fig. 2e. Scale bar: 10 µm. g, Barplots showing fraction of myeloma (big) and small FACS-sorted CD138+/CD319+ cells positive by immunofluorescence and imaging for either CD38 (plasma cell marker) or CD19 (B-cell marker) (n = 10,000 cells). h, Scatterplot of the percentage of plasma cells infiltrated into the bone marrow measured on matching samples by either clinical pathology (x-axis) or clinical cytology (y-axis) (n = 50 samples). Spearman’s rank and Pearson’s correlations and p-values are reported.

