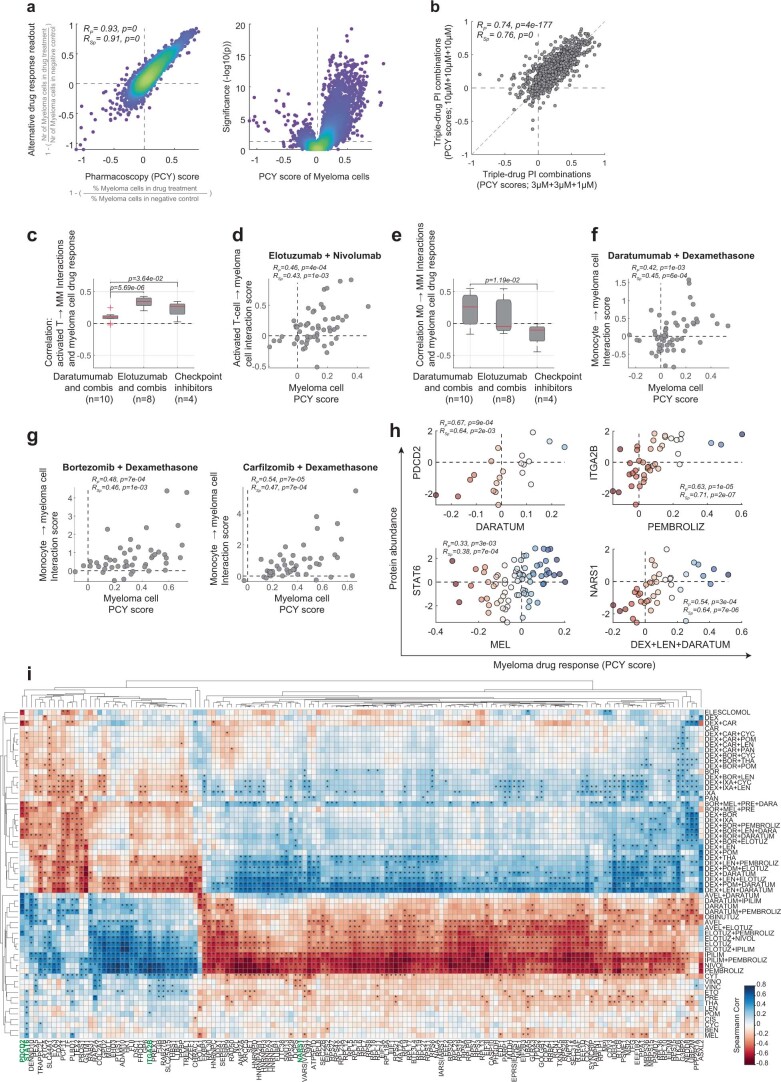
Extended Data Fig. 6. Molecular network underlying the single-cell drug response landscape of myeloma.
a, left, Scatter plot showing the similarity between PCY scores of myeloma cells as used throughout this study (x-axis; calculated as (1 - (% of myeloma cells in drug treatment divided by % myeloma cells in matched control conditions))) and drug response scores based on the number of myeloma cells relative to their number in matched control conditions (y-axis; thus independent of the drug response of healthy monocytes, T cells and other cells in each sample). The scatter plot shows all measured patient samples and drug conditions. Spearman’s rank and Pearson’s correlations and p-values are indicated. (N = 6161, that is 61 drug perturbations times 101 patient samples). a, right, Volcano plot of all measured myeloma PCY scores and their corresponding significance as measured by Student’s t-test against the relevant control wells. b, Scatter plot showing the consistency in ex vivo drug responses to the lowest (x-axis) and highest (y-axis) concentrations of the triple-drug proteasome inhibitor regimes tested across the cohort (N = 6161, that is 61 drug perturbations times 101 patient samples). Spearman’s rank and Pearson’s correlations and p-values are indicated. c, Boxplots showing the distribution of Spearman’s rank correlations (RSp) between the activated T cell to myeloma cell Interaction score and the myeloma cell drug responses across all measured samples (N = 56). RSp values are aggregated across Daratumumab containing treatments (n = 10 treatments), Elotuzumab containing treatments (n = 8 treatments), and the four individually tested immune checkpoint inhibitors (n = 4 treatments). Boxplots as in Fig. 2c. d, Example scatter plot of the activated T cell to myeloma cell interaction score (y-axis) and the myeloma cell drug responses (x-axis) across all measured samples (n = 55) for the combination of Elotuzumab and Nivolumab. Spearman’s rank and Pearson’s correlations with p-values are indicated. e, as in c, but for monocyte to myeloma cell interactions. f, as in d, but for monocyte to myeloma cell interactions for the combination of Daratumumab and Dexamethasone (n = 56 patient samples). Spearman’s rank and Pearson’s correlations with p-values are indicated. g, as in f, but for either Bortezomib and Dexamethasone in combination (left) (n = 47 patient samples), or Carfilzomib and Dexamethasone in combination (right) (n = 48 patient samples). Spearman’s rank and Pearson’s correlations with p-values are indicated. h, Examples of four associations between myeloma drug response (PCY score; x-axis) and myeloma protein abundance as measured by DIA-SWATH proteomics (y-axis). Spearman’s rank and Pearson’s correlations with p-values are indicated. DARATUM to PDCD2 association: n = 21 patient samples; PEMBROLIZ to ITGA2B association: n = 41 patient samples; MEL to STAT6 association: n = 76 patient samples; DEX + LEN + DARATUM to NARS1 association: n = 41 patient samples. i, Clustergram of protein-drug associations (Spearman’s rank coefficients across the cohort) for the 150 proteins with most variable associations across the drug library. Stars indicate RSp with p < 0.05.

