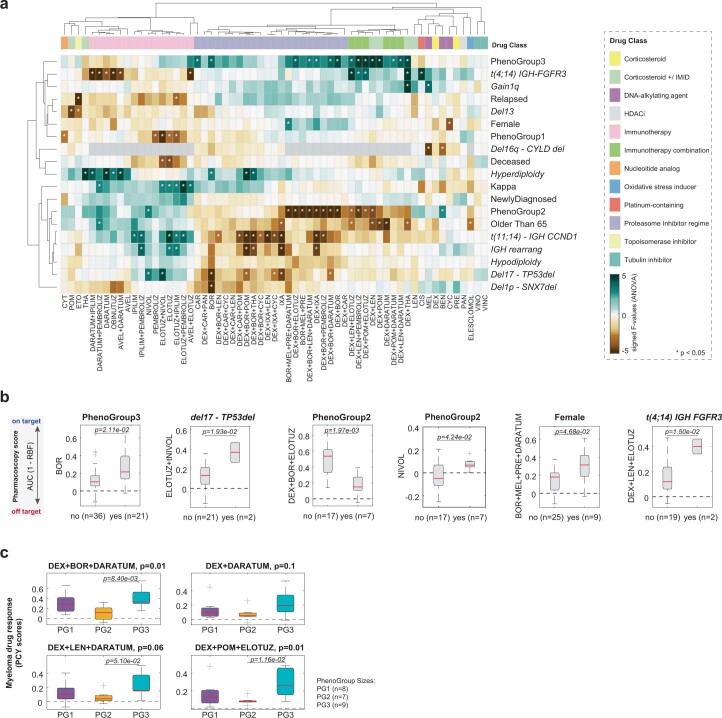
Extended Data Fig. 8. Clinical parameters associated with drug sensitivity.
a, Heatmap showing signed F-values from one-way ANOVAs on drug responses for different clinical and morphological features across the cohort, calculated on clonal patient samples (n = 67). Positive values indicate a feature contributing to a better PCY outcome (sensitivity), whereas negative values indicate association with worse PCY score (resistance). * indicate p-values lower than 0.05. Drug classes are annotated by color above the heatmap, see legend. b, Boxplots showing differences in Pharmacoscopy scores in patients with a selected clinical or morphological feature. P-values indicate significances out of unpaired two-sided Student’s t-tests. No adjustments for multiple comparisons were made. Boxplots as in Fig. 2c. See figure for numbers of patient samples used. c, Selected Pharmacoscopy scores for immunotherapy combinations frequently given in the clinic, shown per PhenoGroup. Numbers of patient samples included in each test are reported. Boxplots as in Fig. 2c.

