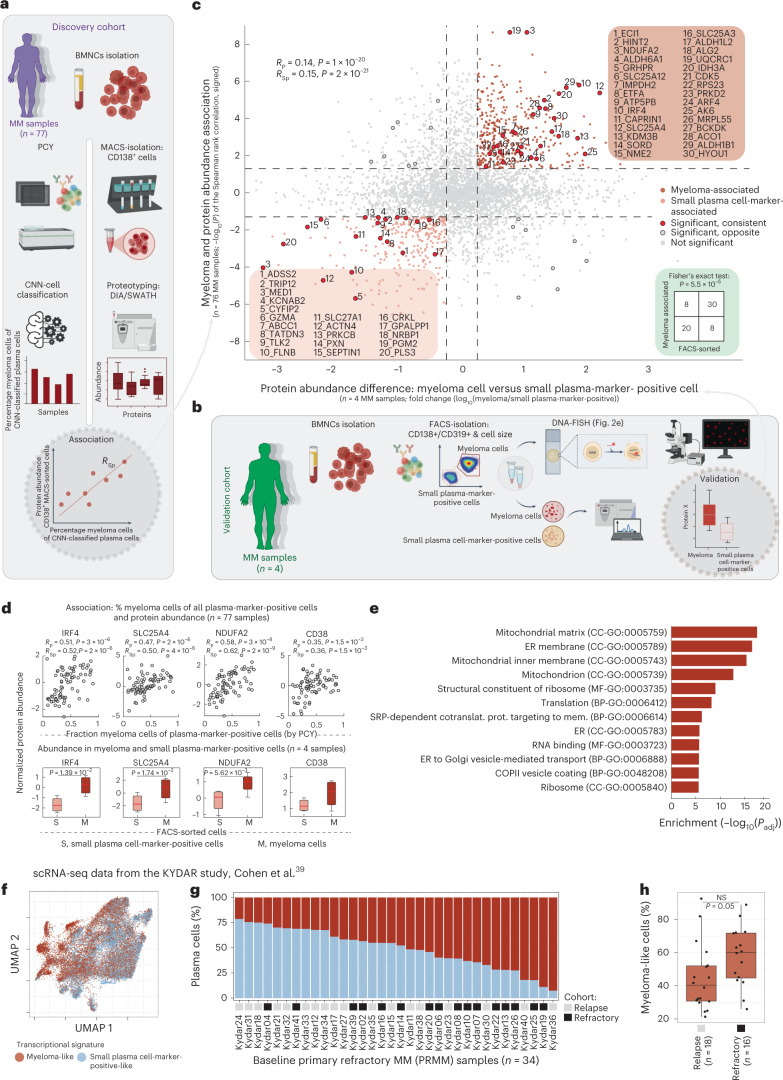
Fig. 4. The molecular proteotype of myeloma cells.
a, Work scheme for the integration of proteotype and PCY data on the discovery cohort (n = 77 patient samples). b, Work scheme for validation cohort (n = 4 patient samples; also analyzed in Fig. 2e). c, Scatter-plot. The y axis represents myeloma and protein abundance associations calculated as in a as signed P values of Spearman’s rank correlations. The x axis represents the difference in protein abundance between FACS-sorted myeloma and small plasma cell-marker-positive cells from four myeloma samples (scheme b). Top-right quadrant shows proteins positively associated with myeloma cells across the discovery cohort (n = 77) and upregulated in myeloma cells in the validation cohort (n = 4). Lower-left quadrant contains negatively associated with and downregulated proteins in myeloma cells. Gray dashed line represent the cutoffs for y axis (P < 0.05) and x axis (absolute fold change > 0.3). Fisher’s exact test insert indicates significance in overlap of proteins, significant in both discovery and validation cohorts (P < 5.47 × 10⁻⁵). Selected proteins are numbered and protein identifiers reported in the respective quadrants. Proteins formatted in bold letters are shown in d (see also Supplementary Table 4). Spearman’s rank and Pearson’s correlations and P values are indicated (top left). d, Example data for myeloma-associated proteins IRF4, SLC25A4, NDUFA2 and CD38. Top scatter-plots indicate protein abundance (y axis) against percentage myeloma by PCY (x axis) (n = 77 patient samples). Bottom box-plots (as in Fig. 2c) show protein abundance (y axis) per FACS-sorted myeloma (M) and small plasma cell-marker-positive cells (S) cells of the validation cohort (n = 4 patient samples). P values from a paired two-tailed Student’s t-test. Pearson’s and Spearman’s rank correlation and associated P values are provided under the title of each upper plot. P values not corrected for multiple testing. e, Gene Ontology enrichment analysis of the myeloma protein signature. P value by hypergeometric test, false discovery rate (FDR)-adjusted for multiple comparisons. SRP, signal recognition particle. f, Uniform Manifold Approximation and Projection representation of scRNA expression levels39 colored by their myeloma-like and small plasma cell-marker-like transcriptional signature (n = 31,305 cells from 34 patients). g, Bar-plots of the percentage plasma cells colored as in f (n = 34 patients). h, Box-plots (as in Fig. 2c) show percentage myeloma-like cells per relapse (n = 18 patients) and refractory (n = 16 patients) disease stages. Indicated P value (not significant) is from an unpaired two-tailed Student’s t-test.

