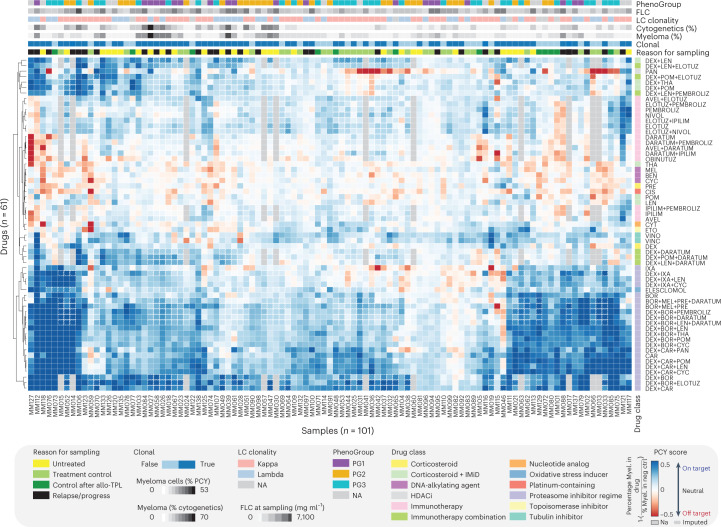
Fig. 5. The single-cell drug response landscape of MM.
Myeloma cell drug responses (PCY scores) bi-clustered across the cohort of 101 patient samples (columns) and 61 unique drugs and drug combinations (rows). Additional sample and drug annotations are provided at the top and right of the drug response matrix (see legend). For visualization purposes, 21% (1,292 of 6,161) of shown drug responses have been imputed by LASSO regression on either measured drug responses or matching myeloma proteotype data. Imputed drug responses are indicated by a dashed outline. LC, light chain, AVEL, avelumab; BEN, bendamustine; BOR, bortezomib; CAR, carfilzomib; CIS, cisplatin; CYC, cyclophosphamide; CYT, cytarabine; DARA, daratumumab; DEX, dexamethasone; ELOTUZ, elotuzumab; ETO, etoposide; IPILIM, ipilimumab; IXA, ixazomib; LEN, lenalidomide; MEL, melphalan; NIVOL, nivolumab; OBINUTUZ, obinutuzumab; PAN, panobinostat; PEMBROLIZ, pembrolizumab; POM, pomalidomide; PRE, prednisone; THA, thalidomide; VINC, vincristine; VINO, vinorelbin.

