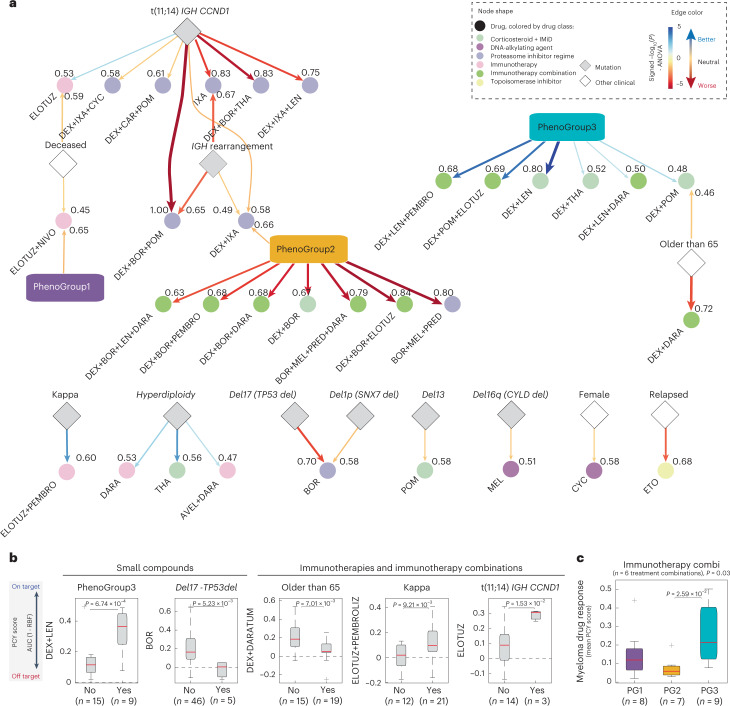
Fig. 7. Therapeutic strategies for clinically defined myeloma subcohorts.
a, Network representing clinical and morphological features associated with myeloma drug sensitivity both by ANOVA analysis as well as by a two-tailed Student’s t-test across n = 67 patient samples. Drugs are represented as circles, colored by their respective drug class. Numbers next to the arrows indicate fraction of times the association is significant in cross-validation. Mutations and other clinical parameters are represented in rhombus shapes and PGs in rectangular shapes in their respective colors. Edge color shows better (blue) or worse (red) sensitivity toward a drug or a drug combination for a group of patients. Drugs and drug combinations are indicated by shortened drug names concatenated by a + symbol (Supplementary Table 5). b, Box-plots (as in Fig. 2c) showing example differences in PCY scores for distinct patient subsets and drugs, associated with a. Indicated P values are from an unpaired two-tailed Student’s t-test; n values indicate number of samples with a selected feature and a measured PCY response. c, Box-plots (as in Fig. 2c) showing the distribution of mean PCY responses per sample across six drugs in the immunotherapy combinations class, grouped by PG (n = 24 patient samples). One-way ANOVA P value is reported, the asterisk indicates a P value from multiple pairwise comparison of the group means using Tukey’s honestly significant difference criterion.

