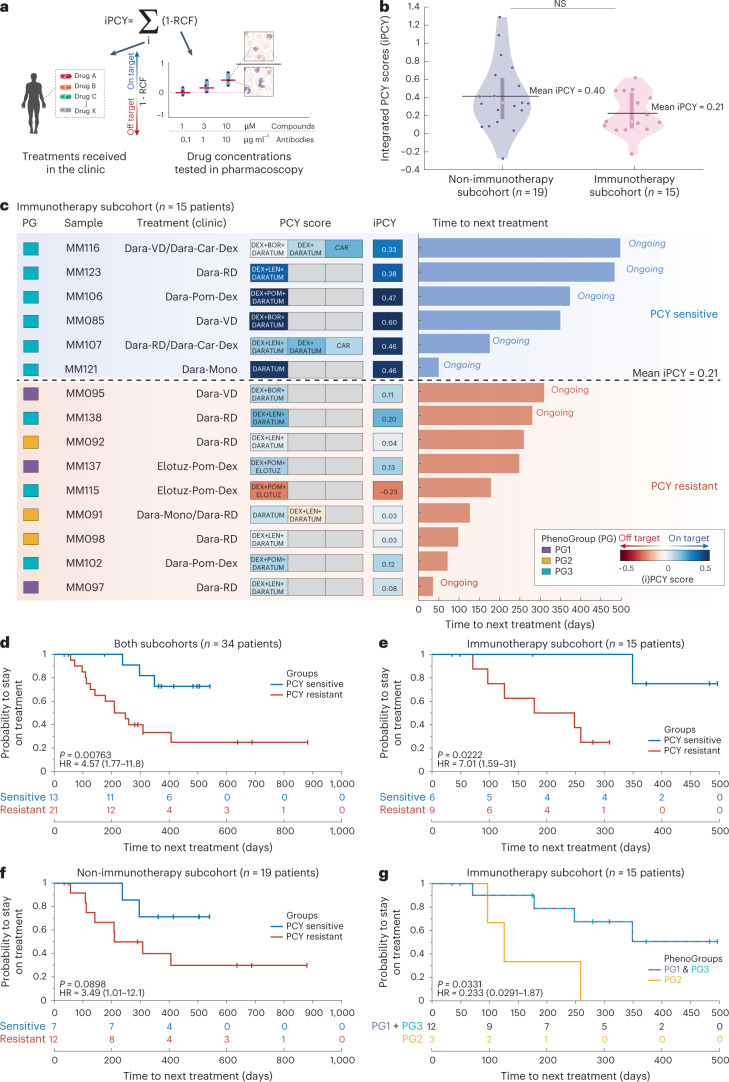
Fig. 8. Ex vivo drug sensitivity stratifies clinical responses.
a, A schematic representation of the iPCY scores: the sum of ex vivo drug responses (1 − relative cell fraction) matching the treatments the patient subsequently received in the clinic. b, Violin plots with a depicted median and kernel density estimate of the data of iPCY scores for the non-immunotherapy subcohort (left; n = 19 patients) and immunotherapy subcohort (right; n = 15 patients). Additionally, mean iPCY of each subcohort is depicted (horizontal black lines) and used as threshold to separate more sensitive (‘PCY-sensitive’) from less sensitive (‘PCY-resistant’) patients. Difference was not significant by unpaired two-tailed Student’s t-test. c, A graphic representation of the clinical immunotherapy subcohort (n = 15 patients). Patients are included based on receiving either daratumumab or elotuzumab-containing treatment following PCY testing and having evaluable response. PG, sample identifier and clinical treatment per patient are reported. Heat map shows the individual PCY scores matching to the treatments given, with their respective iPCYs on the right. Finally, time to next treatment is reported per patient, with blue indicating PCY-sensitive and red PCY-resistant samples as in b. d, Kaplan–Meier curve for the probability to stay on treatment for both subcohorts combined (n = 34 patients) stratified by PCY sensitivity, using the mean iPCY for their matched clinical treatments as a cutoff. P value from log-rank (Mantel–Cox) test and HR of the respective groups including the 95% CIs are reported. Ongoing responses are indicated as vertical tick marks on the Kaplan–Meier curves. Table below reports the number of patients at risk at different time points. e, As in d but for the immunotherapy subcohort (n = 15 patients). f, As in d but for the non-immunotherapy subcohort (n = 19 patients). g, As in e but stratified for the PGs of the corresponding patient samples. Stratification is PG2 versus (PG1 and PG3).

