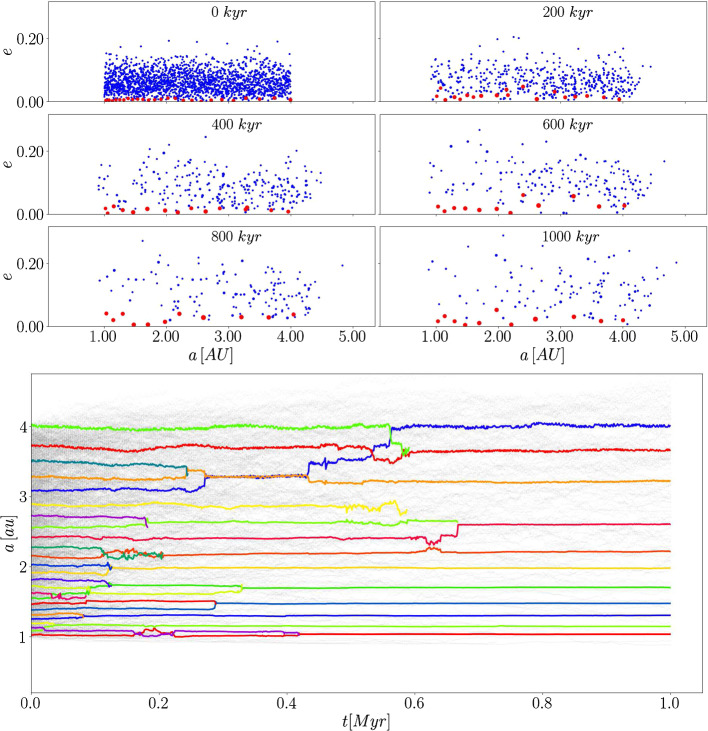
Fig. 10.
The upper six panels show the disk objects semi-major axes and the eccentricity for six different snapshots within the simulation time. The blue dots represent the planetesimals and the red dots the planetary embryos. The bottom panel shows the evolution of the disk objects semi-major axis for the whole simulation time. Different colors indicate the various planetary embryos and the light grey lines show the planetesimals. Collisions between embryos are clearly seen and the greyscale indicates the decreasing number of planetesimals due to the collisions with embryos

