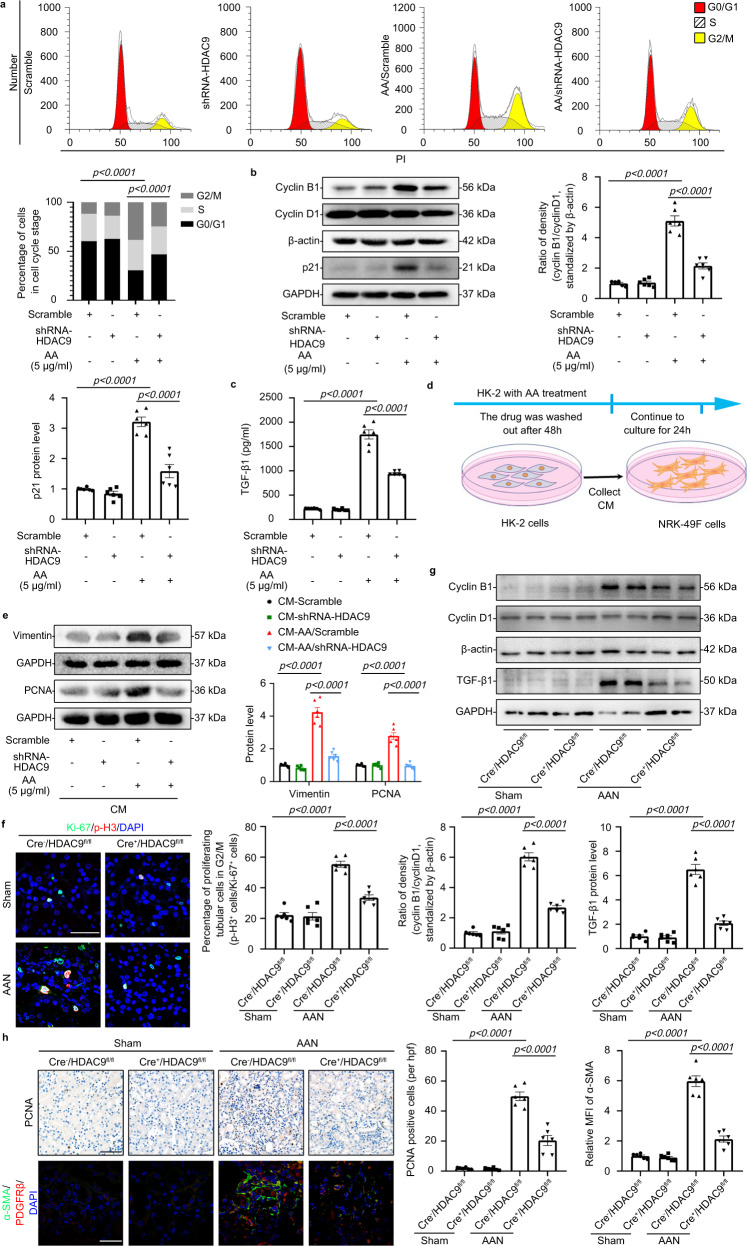
Fig. 4. HDAC9 contributed to epithelial cell cycle arrest in G2/M.
a Cell cycle analysis by flow cytometry for HK-2 in different groups. (n = 6 biologically independent experiments). b Representative Western blot gel documents and summarized data showing the ratio of cyclin B1 to cyclin D1 densities standardized to β-actin and protein levels of p21 in HK-2 with AA treatment. (n = 6 biologically independent experiments). c The level of TGF-β1 in the culture supernatant from HK-2 treated with AA for 24 h. (n = 6 biologically independent experiments). d Experimental scheme for cell treatment: after 48 h treatment of HK-2 cells with aristolochic acid, the drug was washed out and the cells continued in culture for 24 h. The conditioned medium was then collected and added to serum-starved NRK-49F cells. e Protein levels of Vimentin and PCNA in fibroblasts treated with conditioned medium from control or G2/M-arrested HK-2 cells. (n = 6 biologically independent experiments). f Representative photomicrographs of coimmunostaining with antibodies to Ki-67 (anti–Ki-67) and p-H3 (anti–p-H3) on kidneys and the percentage of Ki-67+ p-H3+ cells among total Ki-67+ tubular cells in different groups. Scale bar: white = 20 μm. (n = 6 mice per group). g Representative Western blot gel documents and summarized data showing the ratio of cyclin B1 to cyclin D1 densities standardized to β-actin in isolated tubules and protein levels of TGF-β1 in cortex of kidney from different groups. (n = 6 mice per group). h Photomicrographs and quantifications showing PCNA expression in kidney from different groups of mice (up panel). PCNA-positive cells per high power field (hpf) are counted and shown. Scale bar: black = 50 μm. Representative photomicrographs of kidney sections stained for α-SMA, PDGFRβ+, and DAPI (down panel), as well as quantitative analysis of a-SMA staining in kidney. Scale bar: white = 20 μm. (n = 6 mice per group). Data are expressed as mean ± SEM (a–c, e–h). Two-way ANOVA followed by Tukey’s post-test (a–c, e–h). Source data are provided as a Source Data file.

