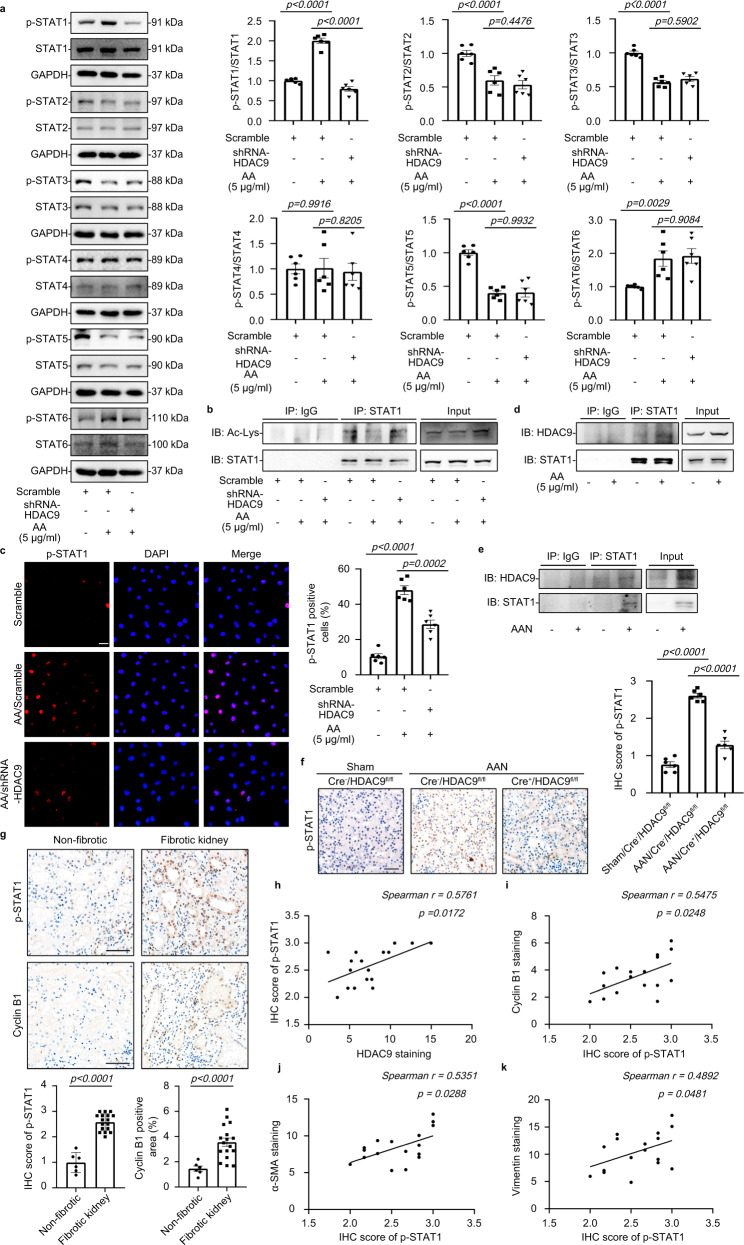
Fig. 5. HDAC9 promoted STAT1 activation by deacetylation.
a Representative Western blot gel documents and summarized data showing the phosphorylation levels of STATs in HK-2 cells. (n = 6 biologically independent experiments). b Immunoprecipitation demonstrated that HDAC9 knockdown reduced the acetylation of STAT1. c Photomicrographs and quantifications showing that HDAC9 knockdown reduced accumulation of p-STAT1 in the nucleus of AA-treated HK-2 cells. Scale bar: white = 20 μm. (n = 6 biologically independent experiments). d. Immunoprecipitation demonstrated that HDAC9 bound to STAT1 in HK-2. e. Immunoprecipitation demonstrated that HDAC9 bound to STAT1 in the cortex of kidney from AAN. f. Photomicrographs and quantifications showing that tubule-specific deletion of HDAC9 reduced the protein levels of p-STAT1 in kidney from AAN. Scale bar: black = 50 μm. (n = 6 mice per group). g Photomicrographs and quantifications of p-STAT1 and cyclinB1 in kidney from normal subjects and patients with CKD, Scale bar: black = 50 μm. (n = 6 for normal subjects, n = 17 for patients with CKD). h–k Correlation analysis between p-STAT1 and HDAC9, cyclinB1, a-SMA and Vimentin expression in all subjects. (n = 17). b and d were repeated three times independently with similar results; e was repeated five times independently with similar results. Data are expressed as mean ± SEM (a, c, f and g). Two-way ANOVA followed by Tukey’s post-test (a, c and f), Two-tailed Student’s unpaired t test analysis (g), nonparametric Spearman’s correlation coefficient r with two-tailed p-value (h–k). Source data are provided as a Source Data file.

