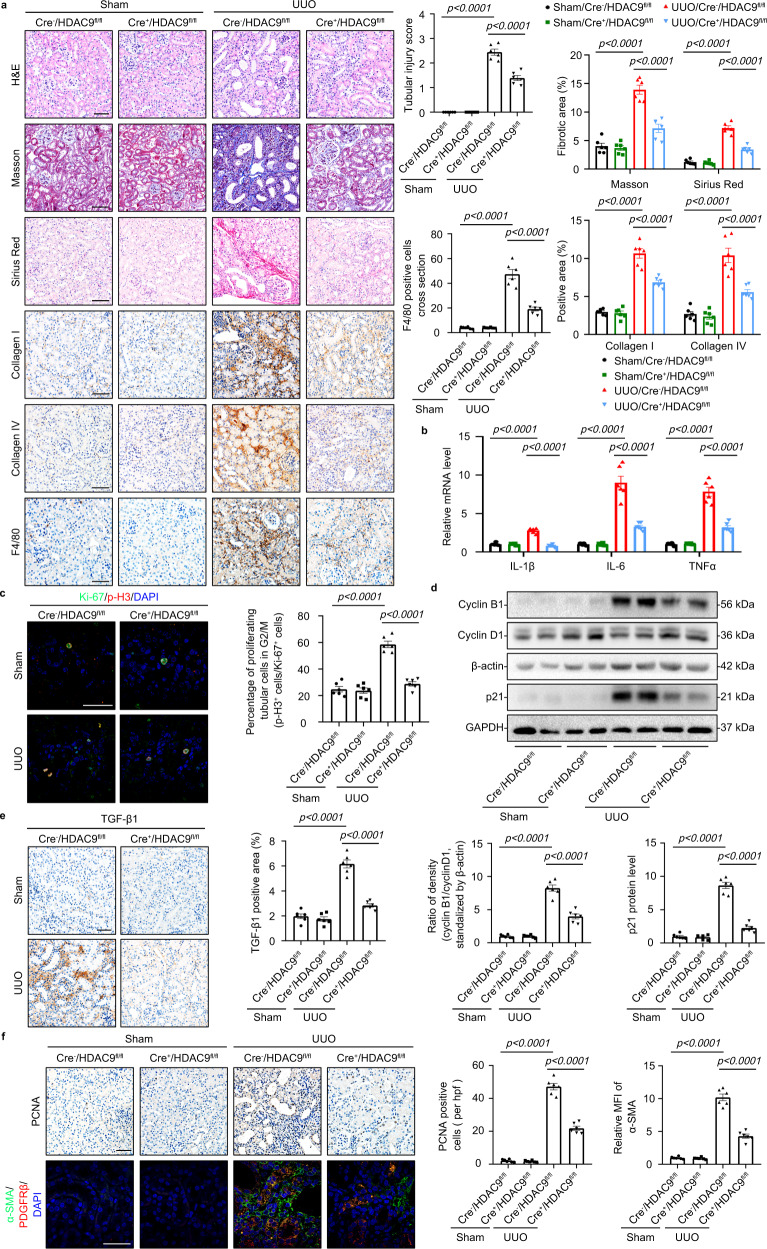
Fig. 7. HDAC9 deletion ameliorated tubulointerstitial fibrosis induced by UUO.
a H&E staining, Masson´s trichrome staining and Sirius Red staining were performed to assess the kidney injury and fibrosis. Photomicrographs and quantifications of Collagen I and Collagen IV staining were performed to assess the kidney fibrosis. F4/80 staining was performed to assess the kidney inflammation in different groups. Scale bar: black = 50 μm. (n = 6 mice per group). b Relative mRNA level of IL-1β, IL-6 and TNFα in the cortex of kidney from UUO mice. (n = 6 mice per group). c Coimmunostaining with antibodies to Ki-67and p-H3 on day-7 kidneys from different groups of mice. Scale bar: white = 20 μm. (n = 6 mice per group). d Representative Western blot gel documents and summarized data showing the ratio of cyclin B1 to cyclin D1 densities standardized to β-actin and the relative protein levels of p21 in isolated tubules from different groups. (n = 6 mice per group). e Photomicrographs and quantifications showing the expression of TGF-β1 in kidney from different groups of mice. Scale bar: black = 50 μm. (n = 6 mice per group). f Photomicrographs and quantifications showing the expression of PCNA in kidney from different groups of mice (up panel); PCNA-positive cells per high power field (hpf) are counted and shown. Scale bar: black = 50 μm. Representative photomicrographs of kidney sections stained for α-SMA, PDGFRβ+, and DAPI (down panel), as well as quantitative analysis of a-SMA staining in the kidneys. Scale bar: white = 20 μm. (n = 6 mice per group). Data are expressed as mean ± SEM (a–f). Two-way ANOVA followed by Tukey’s post-test (a–f). Source data are provided as a Source Data file.

