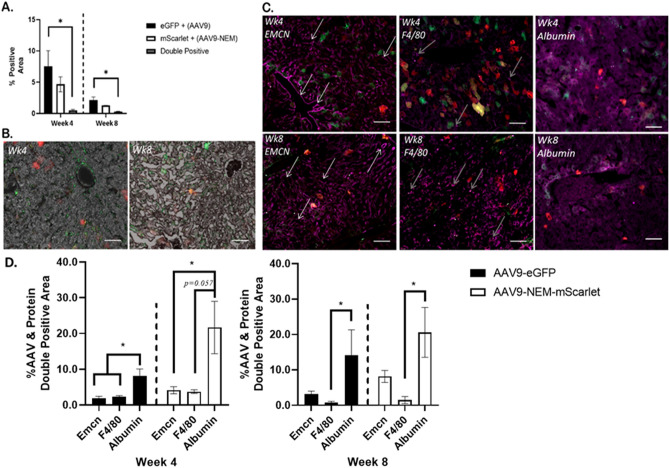
Figure 4.
AAV9 (eGFP; Green) and AAV9-NEM (mScarlet; Red) transduce separate populations in murine liver. (A) eGFP and mScarlet positive area of mouse livers. Double positive areas were minimal at 4- and 8-week timepoints. (B) Representative 10× images of (A) quantification. eGFP = AAV9, mScarlet = AAV9-NEM. (C) Immunofluorescent staining for Endomucin (Emcn), F4/80, or Albumin (Purple) along with AAV9 (eGFP) and AAV9-NEM (mScarlet) cells in serial liver sections. White arrows indicate sinusoidal, Emcn-positive vascular structures, and gray arrows identify some puncta (Kupffer Cells) that are F4/80 positive. Scale bars = 50 µm. (D) Quantification of AAV9 (eGFP) or AAV9-NEM (mScarlet) positive liver tissue that is Emcn, F4/80, or Albumin positive. Comparisons via One-way ANOVA, but Week 8 AAV9-eGFP data compared by Kruskal–Wallace test. AAV dose for the mice is 1.89 × 10¹¹ vg/kg.

