Figure 5.
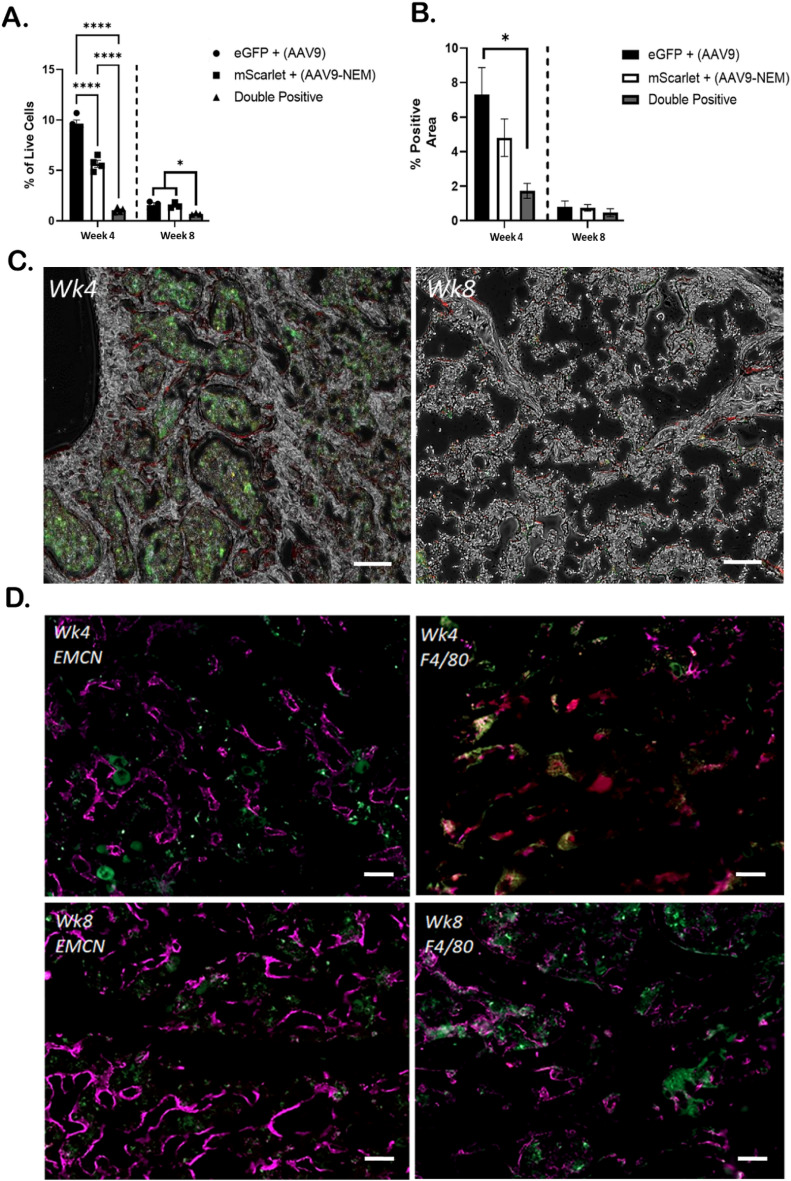
AAV9 and AAV9-NEM transduce separate populations in murine bone marrow. (A) Flow cytometry analysis of live eGFP, mScarlet, and double positive bone marrow cells. (B) GFP and mScarlet positive area of mouse femurs. Double positive areas were minimal at 4- and 8-week timepoints. (C) Representative 10× images. Notice the localization of eGFP (marrow) and mScarlet (bone lining interface) eGFP = AAV9, mScarlet = AAV9-NEM; scale bars = 100 µm. (D) Immunofluorescent staining for Endomucin (Emcn) or F4/80 (Purple) along with AAV9 (eGFP) and AAV9-NEM (mScarlet) cells; scale bars = 50 µm. One-way ANOVA for comparisons. N = 4 for 4-week experiment, N = 3 for 8-week experiment. AAV dose for the mice is 1.89 × 10¹¹ vg/kg.

