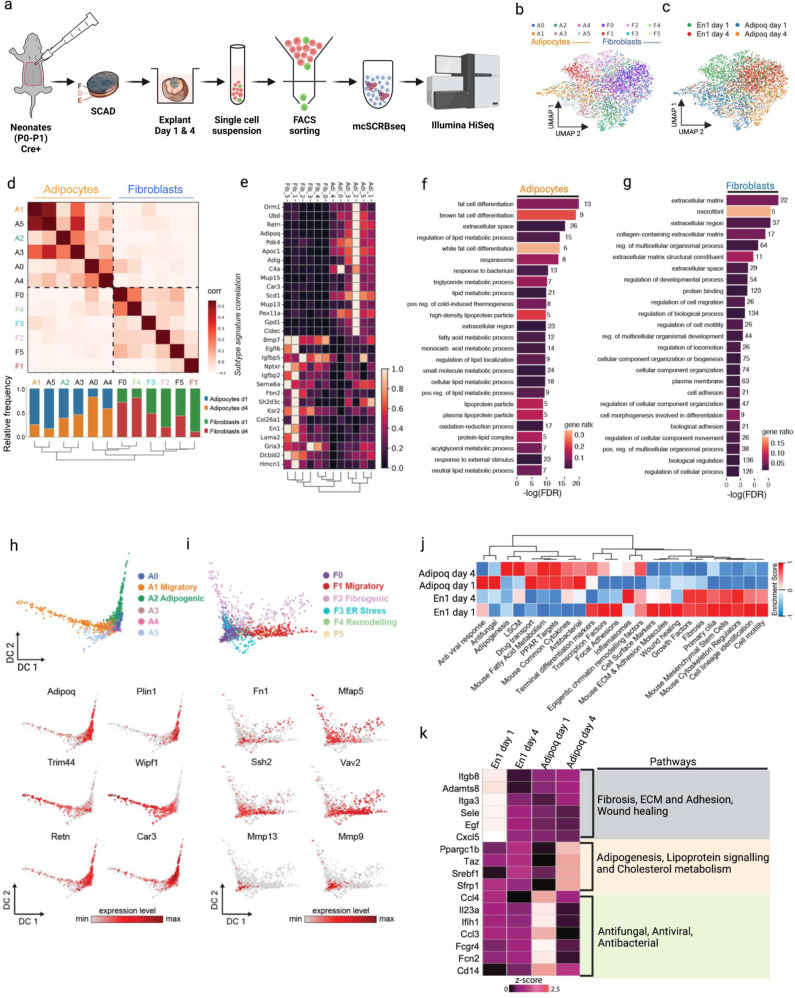
Fig. 1. Adipocyte and fibroblast lineages retain their identities in skin explant model.
a Schematic workflow of ex vivo whole-skin explant assay and molecular crowding single cell RNA barcoding and sequencing (mcSCRBseq). The skin explants from neonatal AdipoqCre;R26mTmG or En1Cre;R26mTmG skin were cultured in 96-well plate with fascia side face up. The GFP+ cells were FACS sorted from explants that were collected 1 day or 4 days after culture for single cell sequencing. F, fascia; D, dermis; E, epidermis. b Dimension-reduced single cell transcriptomic data is visualized through Uniform Manifold Approximation and Projection (UMAP), coloured by Louvain cluster and c time point of extraction. d Similarities of marker gene signatures for the 12 cell states (6 states per lineage) along with relative frequency of each cell state per time point. Colour indicates Pearson correlation coefficients for each pairwise comparison across transcriptional cell states in adipocyte and fibroblast lineages. e The heatmap shows relative expression of the indicated genes across cell states and lineages. f Gene set enrichment results in an adipocyte core signature gene list (88 genes). g Gene set enrichment results in a fibroblast core signature gene list (198 genes). h Diffusion maps show adipocyte cell states and the gene expression levels of the indicated genes. i Diffusion maps show fibroblast cell states and gene expression levels of the indicated genes. j Pathway focused gene expression analysis of adipocytes and fibroblasts at day 1 and day 4. k Expression of feature genes of listed pathway in adipocytes and fibroblasts at day 1 and day 4. Z score of individual gene was normalization read counts across samples.

