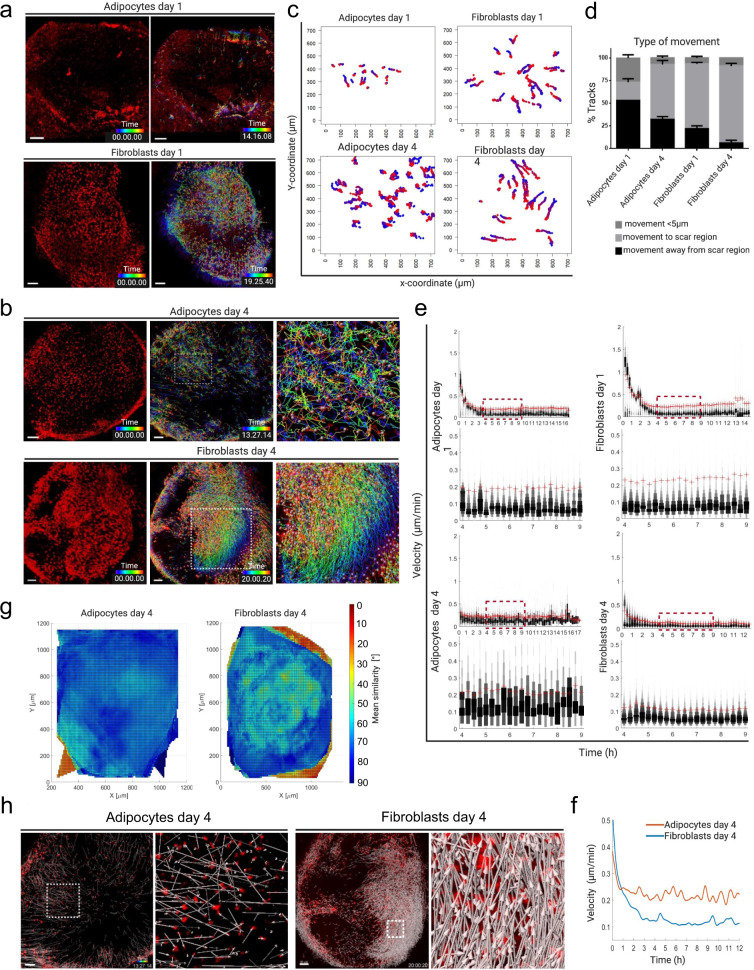
Fig. 3. Distinct adipocyte and fibroblast migrations.
3D whole mount time-lapse imaging snapshots of single-cell tracks skin explants generated from Adipoqcre or En1Cre crossed to R26LSL-H2B-mCherry reporter mice. a Snapshots of adipocyte- and fibroblast-migration tracks on day 1. b Adipocyte and fibroblast tracks on day 4, generated by automated cell tracking using Imaris version 9.2. (Bitplane). c Manual tracks of adipocytes and fibroblasts in the scar region of explants at day 1 and day 4; the plot shows the difference in migration distance and type of movement in the scar region of both adipocytes and fibroblasts. N = 2 videos per time point. Scar regions were cropped (700 µm X 700 µm) from whole explant and cells manually tracked. Blue indicates starting time and red is the end-point. d 3 main types of movement quantified using manually annotated single cell tracks present in c, n = 3 biological repeats, mean ± SD. e Velocity of migratory adipocytes and fibroblasts is calculated using time-lapse videos and automated single cell tracks. Velocity variation and amplitude difference from time point 4 −9 hours across all samples are shown in higher magnification (lower panel). The red crosses (+) indicate the mean velocities of the indicated time points. f Spline graph of day 4 showing differences of mean velocity between adipocytes and fibroblasts. g Neighbour similarity analysis of day 4 explants using automated single-cell tracks generated from 3D time lapse videos. The colour bar represents the movement angles 0° (red, coordinated movement) to 90° (blue, random movement). Fibroblast migrations are coordinated and collective, whereas adipocyte migrations are random and individual. h Directed and non-directed movement of fibroblasts and adipocytes respectively at day 4. Scale bars:100 µm.

