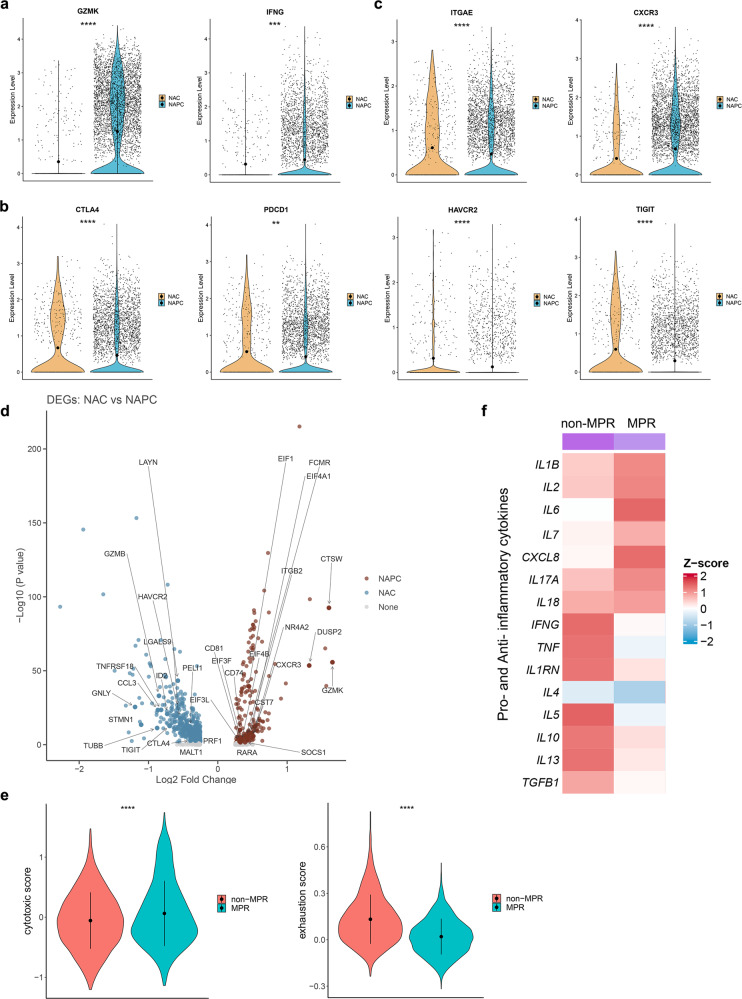
Fig. 2. Transcriptome profiling of CD8+ T-cell clusters after neoadjuvant therapy.
a–c Violin plot showing functional gene expression levels of tumor-infiltrating CD8+ T cells in NAC and NAPC. Data are presented as mean. d Volcano plot showing comparison of DEGs of CD8+ T cells between NAC and NAPC. Inclusion criteria: Log2FC > 0.25, p < 0.05, min.pct > 0.1. e Comparison of CD8 cytotoxic score and exhausted score between non-MPR and MPR in NAPC estimated by the “AddModuleScore” function in Seurat. Data are presented as mean ± SD. f Heatmap displayed the expression levels of pro- and anti-inflammatory cytokines in tumor tissues of non-MPR and MPR patients.

