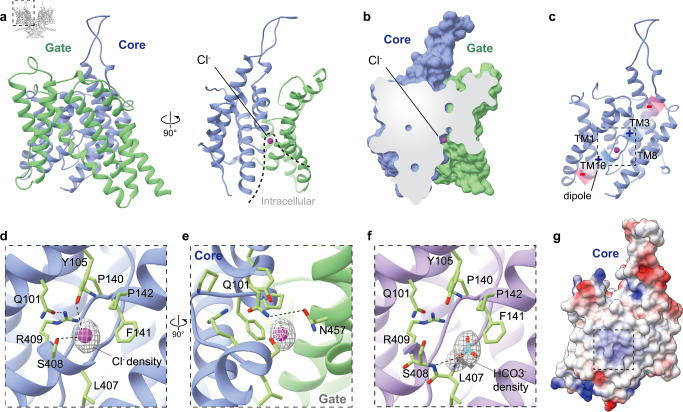
Fig. 2. The TMD and anion binding pocket of pendrin.
a Structural model of pendrin-Cl transmembrane domain (TMD) shown in ribbon representation. Core and gate regions are colored in lime green and dodger blue, respectively. The purple sphere indicates bounded Cl−, and the dotted line describes the intracellular vestibule. b Section of TMD surface model. c Structural model of the core region of pendrin-Cl. Gradient rectangles with charge symbols indicate the helical dipoles of TM3 and TM10. d Details of the anion-binding pocket of pendrin-Cl. The density representing Cl− is shown in the light grey mesh. Interactions of Y105 and S408 side chains proximal to the pocket are shown by the dashed line. The hydrogen bond between Q101 and R409 is shown by the dashed line. e A 90° rotated view of d showing the hydrogen bond between Q101 and N457. f Details of the anion-binding pocket of pendrin-HCO3. The density representing HCO3− is shown in the light grey mesh. Interactions of L407 and S408 backbone proximal to HCO3− are shown by the dashed line. g Electrostatic potential surface of the core region of pendrin-Cl.

