Figure 1.
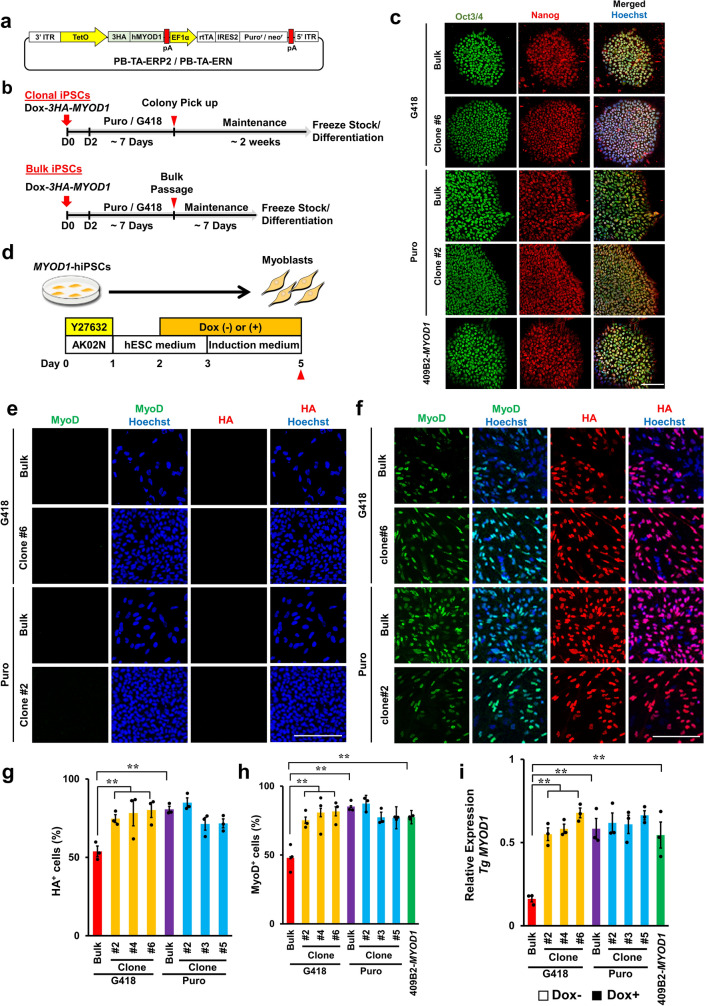
Establishment of bulk and clonal MYOD1-hiPSCs transduced with Dox-inducible 3HA-hMYOD1 (Dox-3HA-MYOD1) and Dox-inducible 3HA-hMYOD1 expression under differentiating conditions. (a) PiggyBac vector for Dox-inducible 3HA-hMYOD1 expression with the selection cassette for G418 or puromycin (Dox-3HA-MYOD1). (b) Schematic of the establishment of bulk and clonal MYOD1-hiPSCs. The upper panel indicates the protocol for clonal MYOD1-hiPSCs, and the lower panel indicates the protocol for bulk MYOD1-hiPSCs. (c) ICC analysis of the established MYOD1-hiPSCs for pluripotent stem cell markers (Oct3/4 and Nanog). The nuclei were stained with Hoechst 33258. All bulk and clonal MYOD1-hiPSCs retained the expression of pluripotent stem cell markers. Scale bar, 50 μm. (d) Schematic of the analysis of transgene expression under differentiation conditions with or without Dox. MYOD1-hiPSCs were induced to differentiate into skeletal muscles in the presence of Dox from day 2 to day 5 or cultured in the absence of Dox. Samples were collected at the times indicated by the closed triangles. (e–h) ICC analysis of the expression of transgenes (HA) and MyoD1 in cells cultured under differentiating conditions without Dox (e) or with Dox (f). Scale bar, 200 μm. Quantitative analyses of HA+ and MyoD1+ cells are shown in g and h, respectively. The expression levels of transgenes (HA) and MyoD1 were lower in the G418-bulk line than in the G418-clones but were similar in the Puro-bulk line and the Puro-clones. (i) Transgene expression in bulk and clonal MYOD1-hiPSCs established with G418 or puromycin selection in the differentiating conditions in the presence of Dox as examined by qRT‒PCR and compared with that of control 409B2-MYOD1-hiPSCs. The amount of cDNA was normalized to that of human-specific β-ACTIN. The G418-bulk line expressed transgenes at only approximately 25% of the level observed in the G418 clones or 409B2-MYOD1-hiPSCs. The data are presented as the mean ± SEM, n = 3. *p < 0.05, **p < 0.01. ANOVA followed by post hoc Bonferroni test.

