Figure 3.
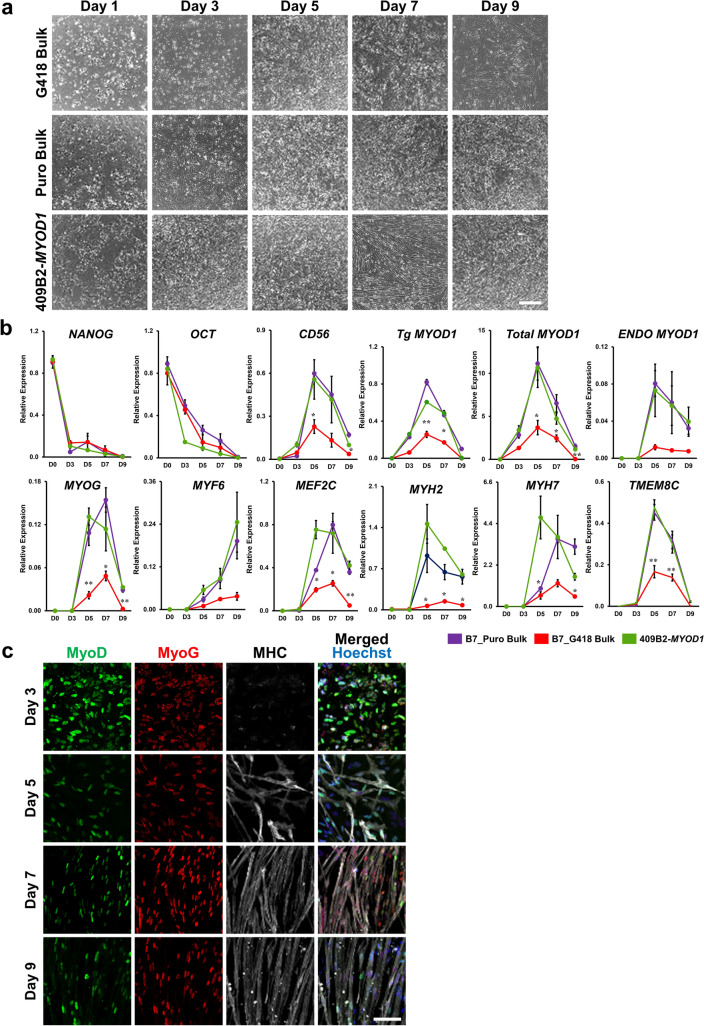
Time course analysis revealed highly efficient myogenic differentiation of Puro-bulk MYOD1-hiPSCs. (a) Brightfield images showing the time course of myogenic differentiation of G418-bulk and Puro-bulk MYOD1-hiPSCs as well as control 409B2-MYOD1-hiPSCs. After day 7, G418-bulk MYOD1-hiPSCs featured nonmuscle cells with flattened morphology and showed fewer myotubes and larger spaces among myotubes than Puro-bulk and clonal MYOD1-hiPSCs. Scale bar, 100 μm. (b) Time course gene expression analysis of G418-bulk, Puro-bulk, and control 409B2-MYOD1-hiPSCs along with myogenic differentiation. The amount of cDNA was normalized to that of human-specific β-ACTIN and is presented as the expression relative to that in undifferentiated hiPSCs (NANOG and OCT3/4), that in the human myoblast cell line Hu5/KD3 differentiated for 3 days (CD56, total and endogenous MYOD1, MYOG, MYF6, MEF2C, MYH2, MYH7, and TMEM8C), or that in EKN3-MYOD1-hiPSCs differentiated for 5 days (Tg MYOD1). The data are presented as the mean ± SEM, n = 3. *, p < 0.05, **, p < 0.01 vs. 409B2-MYOD1-hiPSCs. ANOVA followed by post hoc Bonferroni test. (c) Time course ICC analysis of Puro-bulk MYOD1-hiPSCs for MyoD, MyoG, and MHC along with myogenic differentiation. The number of MyoD+ cells gradually decreased after day 7, while MHC+ cells appeared around day 5 and formed aligned myotubes from day 7. Scale bar, 100 μm.

