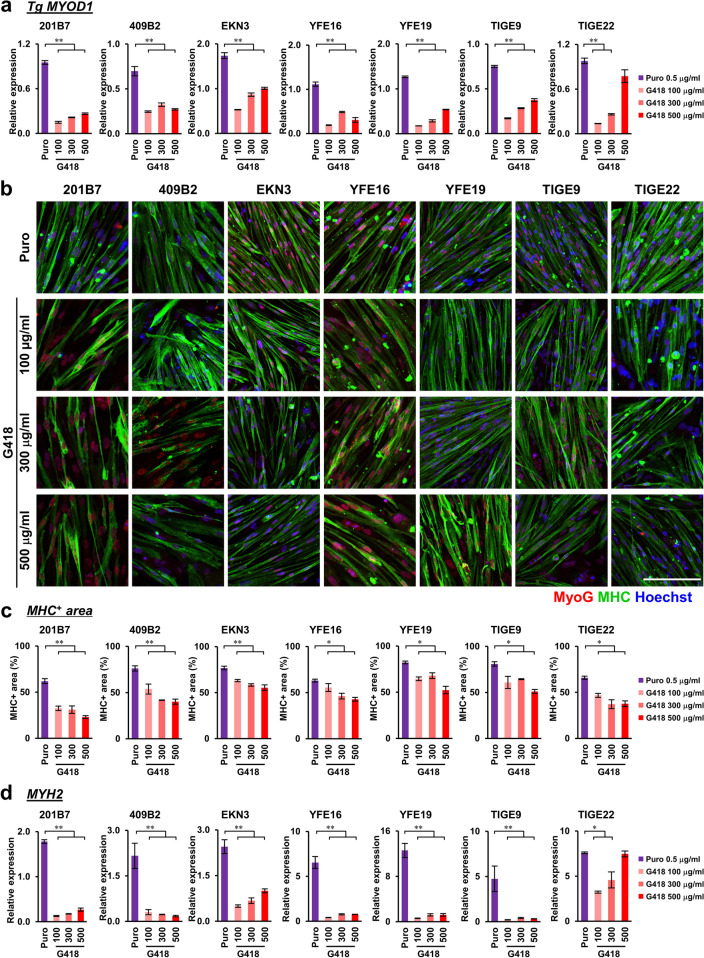
Figure 4.
Reproducibility of higher transgene expression and more efficient skeletal muscle differentiation in seven bulk MYOD1-hiPSCs established by puromycin selection compared with those established by selection with various concentrations of G418. (a) Transgene expression in seven MYOD1-hiPSC clones (201B7, 409B2, EKN3, YFE16, YFE19, TIGE9, and TIGE22) established with puromycin (0.5 μg/ml) or G418 (100 μg/ml, 300 μg/ml, 500 μg/ml) selection in the differentiating conditions (day 5) in the presence of Dox as examined by qRT‒PCR. The amount of cDNA was normalized to that of human-specific β-ACTIN. The G418-bulk line exhibited poor transgene expression even when the cells were selected with high concentrations of G418. The data are presented as the mean ± SEM, n = 3. *, p < 0.05, **, p < 0.01. ANOVA followed by post hoc Bonferroni test. (b) ICC analysis of myotubes derived from bulk-MYOD1-hiPSCs established from seven hiPSC clones by selection with puromycin or various concentrations of G418 for the expression of MyoG and MHC at day 9 of differentiation. The nuclei were stained with Hoechst 33258. All seven Puro-bulk MYOD1-hiPSC lines efficiently differentiated into skeletal muscles in the presence of Dox, whereas G418-bulk MYOD1-hiPSC lines showed moderate or poor differentiation potential regardless of the concentration of G418 used for the selection. Scale bar, 200 μm. (c) Quantitative analysis of the parameter for skeletal muscle differentiation, the proportion of MHC+ area in the total area. The data are presented as the mean ± SEM, n = 3. *, p < 0.05, **, p < 0.01. ANOVA followed by post hoc Bonferroni test. (d) Expression of MYH2 in bulk MYOD1-hiPSC lines established from seven hiPSC clones by selection with puromycin (0.5 μg/ml) or various concentrations of G418 (100 μg/ml, 300 μg/ml, 500 μg/ml) at day 9 of differentiation. The amount of cDNA was normalized to that of human-specific β-ACTIN and is presented as the relative expression in the human myoblast cell line Hu5/KD3 differentiated for 3 days. The data are presented as the mean ± SEM, n = 3. *, p < 0.05, **, p < 0.01. ANOVA followed by post hoc Bonferroni test.

