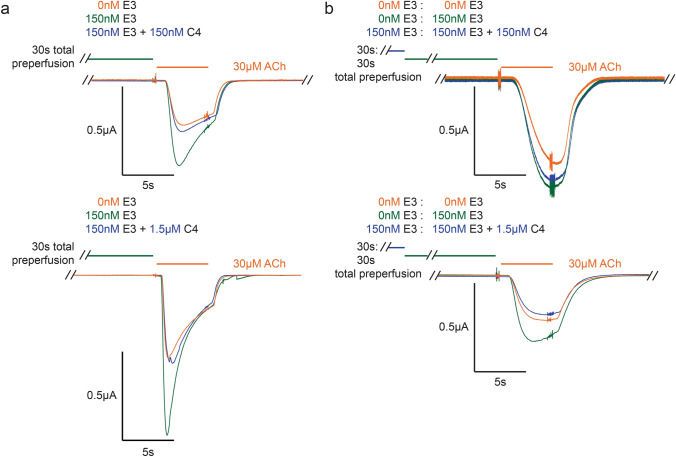
Fig. 6.
E3–C4 competition. a Top and bottom are representative traces (of n = 3 and n = 5 resp.) of a mixture of C4 (150 nM and 1.5 µM, top and bottom resp.) and 150 nM E3 using a modified 30 s “purely pre-perfusion” protocol, which shows that C4 blocks E3 potentiation. b Top and bottom are selected traces (from n = 3) of C4 (150 nM and 1.5 µM, top and bottom resp.) and 150 nM E3 competition using a “double purely pre-perfusion” protocol, where 150 nM E3 was pre-perfused for 30 s before the combined mixture. The concentration-dependent competition strongly suggests that the two VHH’s compete for an overlapping binding site

