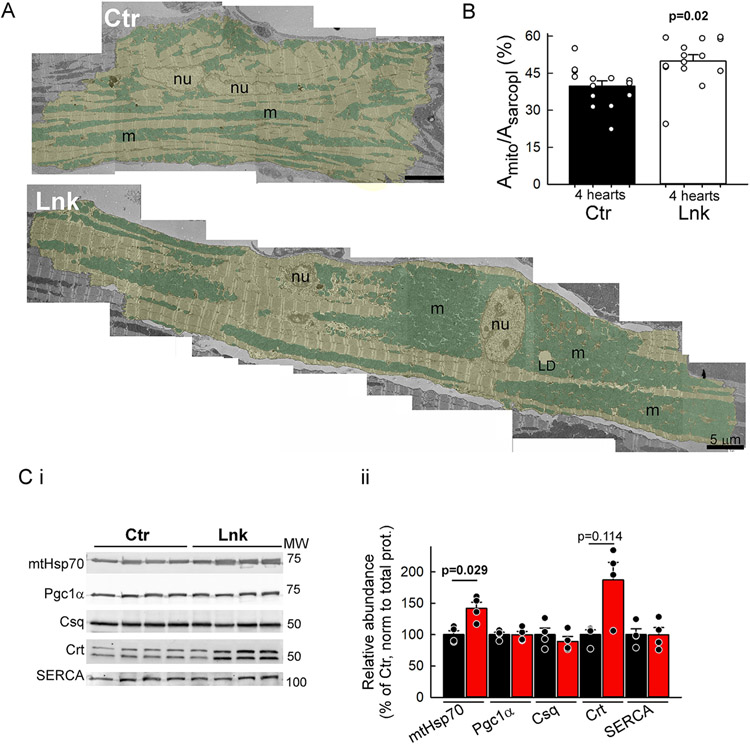
Figure 2: Mitochondrial and SR remodeling in the linker myocardium.
A. Representative TEM montages of a control (Ctr) and a linker-expressing (Lnk) cardiomyocyte (yellow shade) in perfusion-fixed papillary muscles. Note the large mitochondrial (cyan shade) clusters in Lnk that can reach from the perinuclear area to the intercalated disc. Nu, nucleus; m, mitochondria; LD, lipid droplet. B. Mitochondrial densities (mitochondria-occupied area of the sarcoplasm). n=14 myocytes each from N=4 Lnk and 4 Ctr hearts; 3-4 myocytes/heart. Means±SEs. P values from mixed-effects regression/Fisher’s LSD. C. Relative expression of matrix protein mtHsp70, mitochondrial biogenesis regulator Pgc1α, jSR-resident calsequestrin (Csq), nSR/ER-resident calreticulin (Crt) and SERCA2a. Pooled data from VCM lysates (N=4 hearts each). Band densities were normalized first to the total protein in the lane (from Ponceau-S gel image), then to the mean of the respective Ctr. Means±SEs. P was calculated for each protein by Mann-Whiney Rank Sum test. See all p values in Online Dataset S1.

