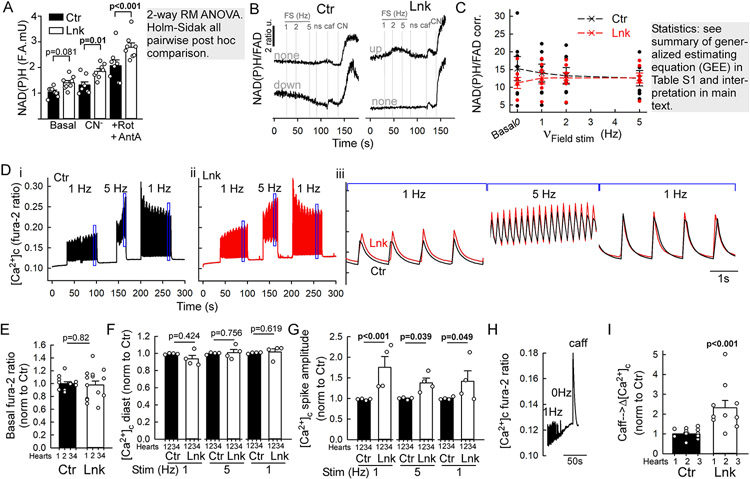
Figure 4. Assessment of EBC, metabolic fitness and Ca2+ signaling in the linker myocytes.
A-C. NAD(P)H and FAD autofluorescence imaging in VCMs freshly isolated from Ctr and Lnk. Isoproterenol 100 nM was added to the superfusate to provide sympathetic tone. After baseline recording, electric field stimulation (FS) at increasing frequencies (1-2-5 Hz) was applied then stopped (ns), followed by sequential additions of caffeine (Caf 10 mM), NaCN (CN 40 μM), and antimycin A+rotenone (A+R, 10 μM/0.25 μM). (A) NAD(P)H autofluorescence at baseline (basal), after respiratory complex IV (NaCN) and additional complex I&III inhibition (A+R). Means±S.E., N=8 hearts each. B. Representative timecourses of NAD(P)H/FAD ratio from individual Ctrl and Lnk myocytes (n>170 each). C. Cumulated corrected NAD(P)H/FAD ratio levels at the indicated steps of the stimulation protocol, collected from corresponding timecourse trace segments. Before forming the ratio, minimum FAD fluorescence at NaCN or A+R was subtracted to correct for mRFP crosstalk (see details in Expanded Methods). Means±SEs, n=7 independent experiments (one Ctr and Lnk heart each; 4-8 technical replicates/coverslips; 2-8 VCMs/field). D-I. [Ca2+]c (fura-2 ratio) responses of primary VCMs to sequential FS periods at 1Hz, 5Hz, 1Hz, each followed by a short (~30s) pause. After the last pause, caffeine (caff, 10 mM) is added to discharge SR Ca2+. Isoproterenol 100 nM is present throughout to provide sympathetic tone. D. Representative timecourses from a Ctr and Lnk (red) VCM (n(cells)=39 for Ctr and 53 for Lnk). Boxed segments in (i-ii) are overlaid on expanded timescale in (iii). E-I. Cumulated parameters extracted from the timecourses. For each experiment (pair of hearts), individual cells were normalized to the mean of the control (see Figure S5E-G for values without normalization to Ctr). E. Basal Fura-2 ratios. F. Diastolic [Ca2+]c at the indicated FS frequencies. G. [Ca2+]c spike amplitudes (systolic-diastolic difference) during FS. E-G: N=4 pairs of hearts; 2-6 coverslips each (2-7 VCM/field). Means+s.e. P was calculated using mixed random intercept model for E; for F-G, 2-way RM ANOVA on rank-transformed data, Holms-Sidak all-pairwise post hoc comparison. H. Exemplar timecourse of the caffeine response in a linker-VCM (n=10 cells). I. Amplitudes of caffeine responses, (see also Figure S5G). n=15(ctr) and 10(Lnk) myocytes (N=3 pairs of hearts, 3-7 VCMs each. Means ± SEs. P: mixed random intercept model).

