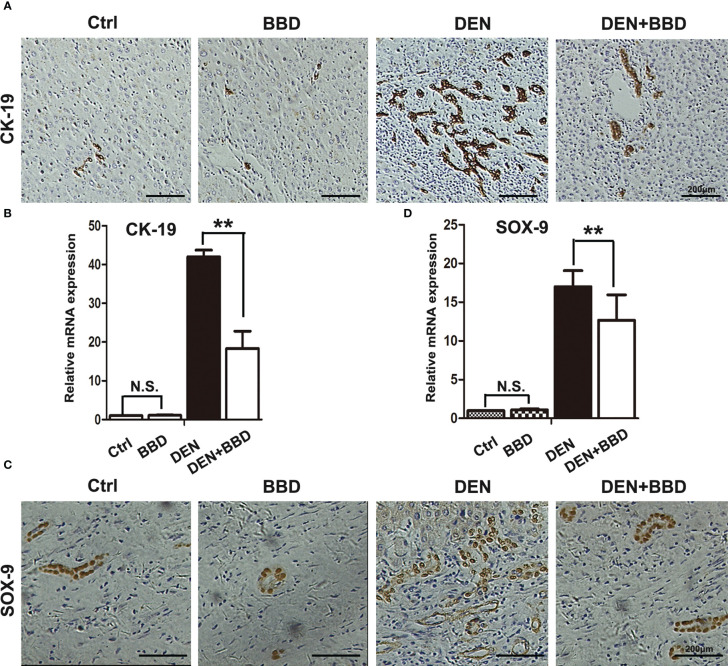
Figure 3.
BBD attenuated ductal reaction. (A, B) Representative IHC staining of liver sections for the protein expression of CK-19, a marker of HPCs, was analyzed and quantitatively measured by RT-PCR. (C, D) Representative IHC staining of liver sections for the protein expression of Sox-9, a marker of HPCs, was analyzed and quantitatively measured by RT-PCR. Differences were analyzed using a two-tailed Student’s t-test (Compared to DEN group, **P < 0.01; compared to Normal group, N.S., no significance).

