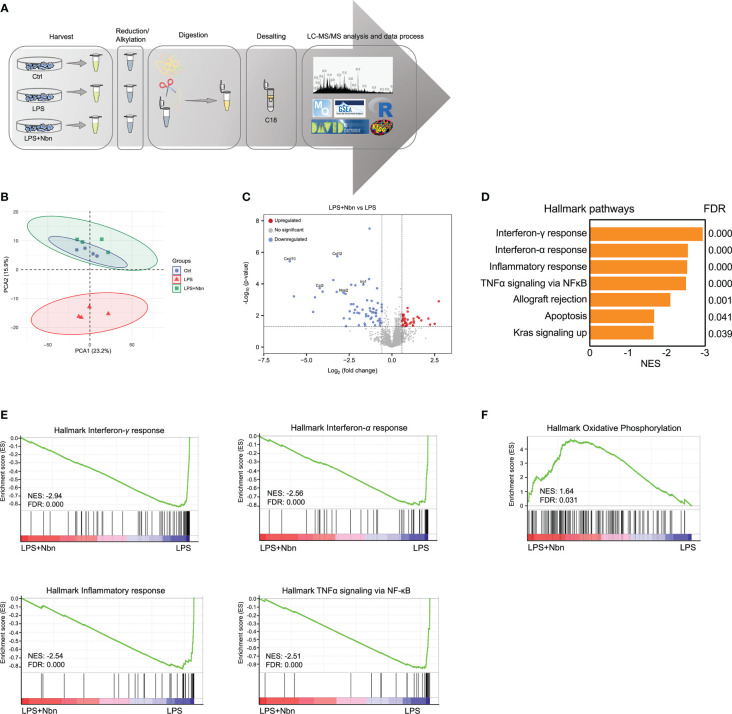
Figure 2.
Norbergenin (Nbn) regulates global proteome associated with inflammatory process. (A), Experimental design for proteomic analysis. (B), PCA analysis of total identified proteins by proteomic analysis in iBMDMs pretreated with or without 50 μM Nbn followed by stimulation of LPS (200 ng/mL) for 8 h. (C), Volcano plot showing proteins that were differentially expressed in iBMDMs pretreated with and without 50 μM Nbn for 1 h in the presence of LPS (200 ng/mL) for 8 h. Blue and red dots represent proteins significantly downregulated and upregulated (fold change > 1.5, p value < 0.05), respectively. (D), GSEA of hallmark gene set from Molecular Signatures Database of the Broad Institute, showing the most enriched downregulated protein sets in LPS pretreated with norbergenin relative to only LPS-stimulated iBMDMs. Normalized enrichment scores (NES) are presented for pathways with false discovery rates (FDR) < 0.05. (E), GSEA plots of interferon-γ response, interferon-α response, inflammatory response and TNFα signaling via NFκB protein signatures in Nbn-pretreated then LPS-stimulated iBMDMs relative to only LPS-stimulated iBMDMs from the analysis in (D) with members of the protein set presented in the ranked list of proteins. (F), GSEA analysis of the “Oxidative phosphorylation” protein signatures. The x-axis of the plots(E, F) represents the ranking metric of the protein set, which is based on the correlation between the protein expression values and two different treatments. The y-axis shows the running enrichment score, which measures the degree to which the gene set is overrepresented at the top (F) or bottom (E) of the ranked protein list. Data are presented as mean ± SEM of n = 4 independent experiments.

