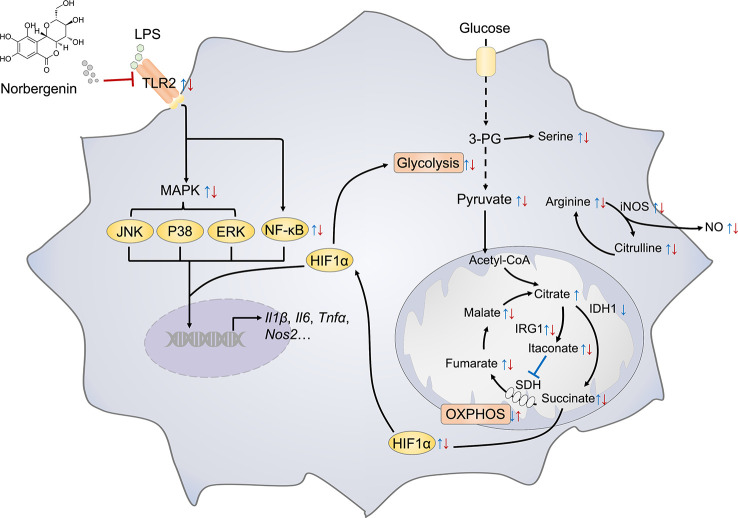
Figure 9.
Schematic representation illustrating the mechanism of norbergenin (Nbn) preventing inflammation in macrophages. Key metabolite and inflammatory pathways that were significantly regulated by LPS or LPS + Nbn are shown. Blue arrow indicates the metabolite expression of LPS vs Control (Ctrl). Red arrow indicates the metabolite expression of LPS + Nbn vs LPS. The arrow direction indicates the increase (↑) or decrease (↓) of the corresponding metabolite caused by LPS vs Ctrl or LPS + Nbn vs LPS.

