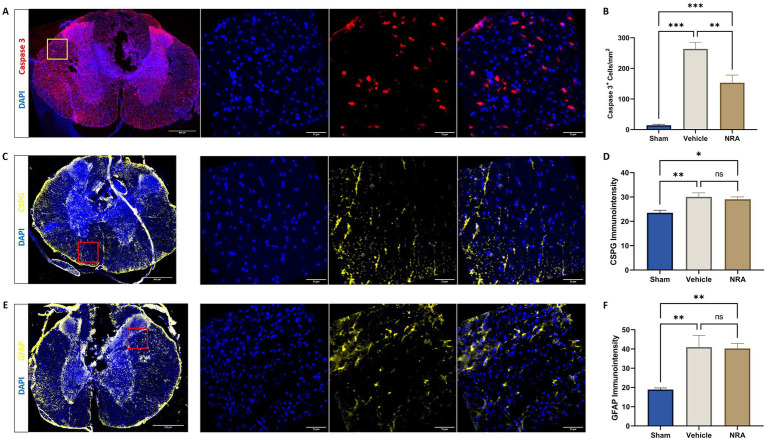
Figure 5.
Spinal cord cross-sections of a vehicle animal at 10 × and 40 × magnification stained for Caspase 3 (A, red), CSPG (C, yellow), and GFAP (E, yellow). (B) Mean cell density (cells/mm2) of DAPI+&Caspase 3+ apoptotic cells and mean immunointensity of CSPG (D) and GFAP (F) in the spinal cord 7 days after SCI/sham surgery (n = 6/group; one-way repeated measures ANOVA followed by post-hoc Tukey-HSD-test; ***p < 0.001; **p < 0.01; *p < 0.05; ns = not significant).

