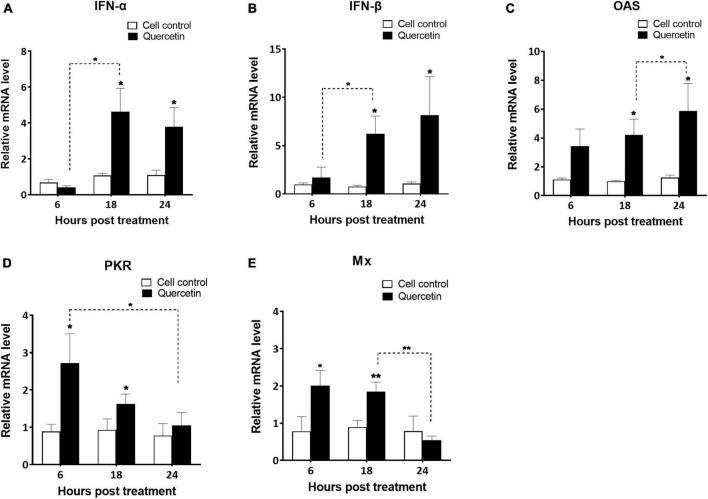
FIGURE 4.
Activation of interferon-stimulated genes in swine cells treated with quercetin. LFBK cells were treated with 625 μM quercetin, collected after 6, 18, and 24 h, and mRNA levels of interferon-stimulated genes such as IFN-α (A), IFN-β (B), OAS (C), PKR (D), and Mx (E) were analyzed using quantitative real-time reverse transcription-PCR (RT-qPCR). Error bars indicate standard deviations from the mean. Unpaired t-tests were performed to identify significant differences. *P < 0.05, **P < 0.01.

