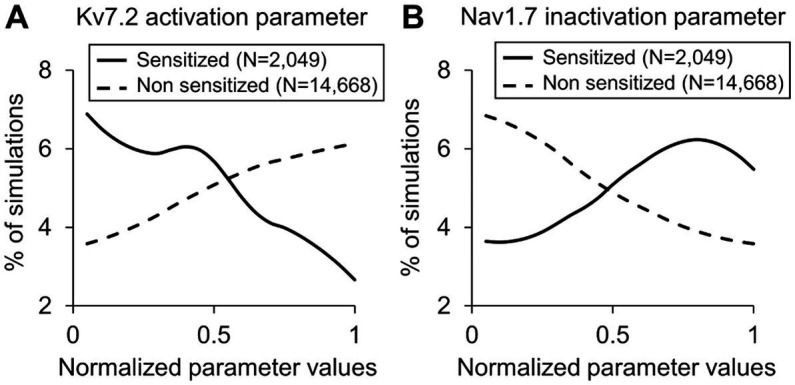
Figure 4.

Distributions of parameter values representing (A) Kv7.2 activation and (B) Nav1.7 inactivation across the simulations of the sensitized neuron group (solid lines) and the non-sensitized neuron group (dashed lines). The x-axis indicates the normalized parameter values, and the y-axis represents the percentage of simulations in each neuron group in which the parameter values fell within a particular range (described in the “Methods” section).
