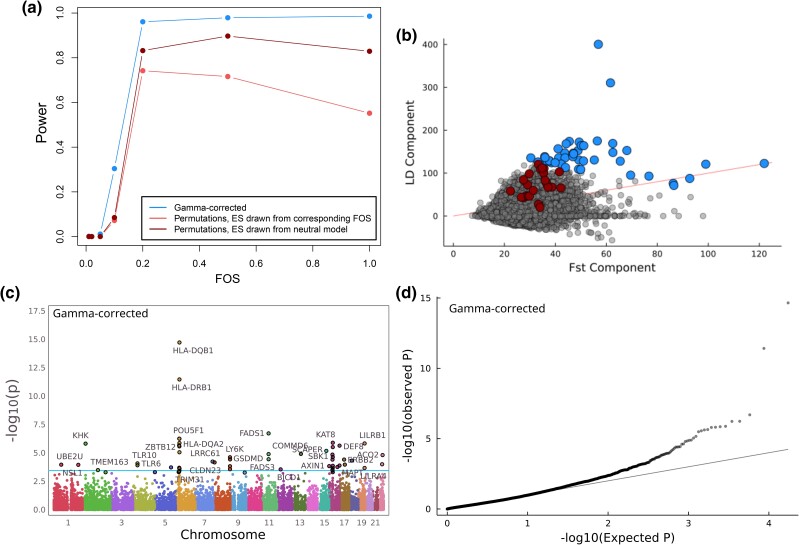
Fig. 2.
Using a gamma-corrected P-value, we identify 45 genes with evidence of selection. a) Power curves for each P-value method, based on simulations (Methods). We calculated the power for the gamma-corrected version of the test, as well as for 2 variations of the effect-permuted test. In the first, we drew the effect sizes from the simulation that modeled the corresponding selection strength, and for the other from the neutral effect model. FOS, fitness optimum shift. b) The score can be decomposed into its -like component and its LD-like component. Significant () genes in 1 kG for the gamma-controlled and effect-permuted P-values are highlighted in blue and red, respectively, while the red line indicates where . The score for each gene is obtained by adding the two components together. The Spearman rank correlation between the components is 0.15. c) Manhattan plot and d) QQ-plot for gamma-corrected P-values for 17,388 genes. The horizontal line in (c) at −log10(p) = 3.95 corresponds to .

