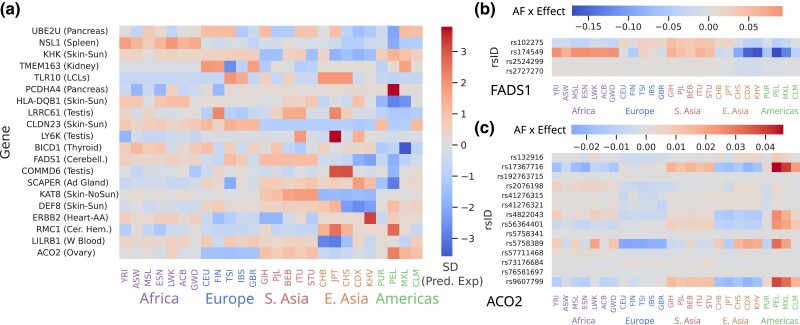
Fig. 4.
Different combinations of variant effects can drive predicted differences. a) Median predicted expression in each 1 kG population for the top gene in each peak of the gamma-corrected P-values. For display purposes, for each gene is standardized across populations. b) for FADS1 there is one primary haplotype (tagged by rs174549), while for c) ACO2 there are 3 variants driving the upregulation in PEL. Cells are colored by the product of JTI effect size times effect allele frequency in each population. Values in b) and c) are mean-centered for each variant.

