Figure 2.
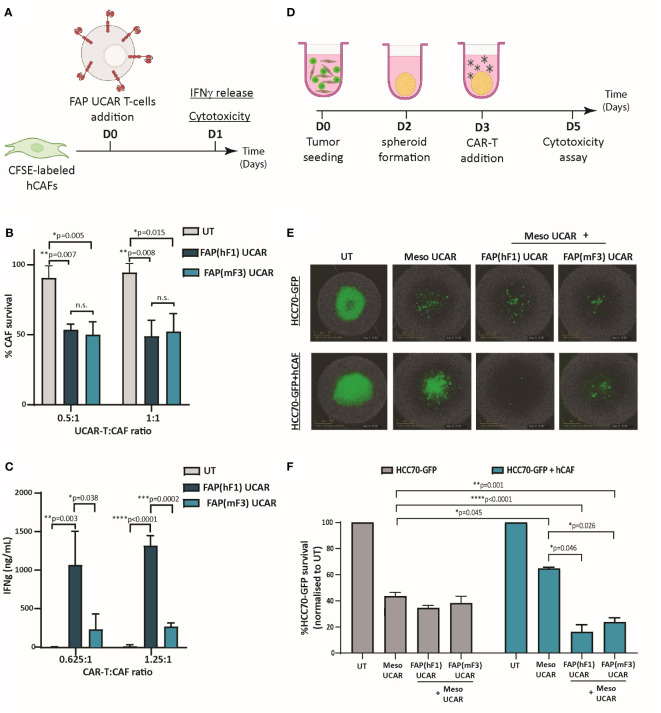
FAP UCAR T-cells efficiently kill FAP+ CAFs and enhance Meso UCAR T-cell cytotoxicity against tumor cells and CAF spheroid co-cultures in vitro. (A) Experimental strategy for assessing FAP UCAR T-cell IFNγ-release and cytotoxicity against TNBC patient-derived CAFs. (B) Bar graph representing percentage of CAF survival post 24 hour co-incubation with UT, FAP(hF1) UCAR or FAP(mF3) UCAR T-cells at two different Effector : Target ratios. Results representative of two independent experiments with two donors each, n=3 technical replicates per donor per experiment. Bars show the means ± SD; P-values determined by Student t test (two-tailed, unpaired). (C) Bar graph representing IFNγ levels in supernatant post 24-hour co-incubation of CAF with UT, FAP(hF1) UCAR or FAP(mF3) UCAR T-cells at two different Effector: Target ratios. Results representative of two independent experiments with two donors each, n=4 technical replicates per donor per experiment. Bars show the means ± SD; P-values determined by Student t test (two-tailed, unpaired). (D) Schematic of FAP UCAR and Meso UCAR T-cell cytotoxicity assay against 3-D spheroids of TNBC cell line HCC70-GFP alone or co-cultured with TNBC-derived CAFs. (E) Representative fluorescent images of HCC70-GFP and HCC70-GFP co-incubated with TNBC-derived CAF spheroids on day 5 of cytotoxicity assay as outlined in (D). (F)Bar graph representing percentage HCC70-GFP tumor cell survival post cytotoxicity assay outlined in (D). Data representative of two independent experiments with two donors each, n=4 technical replicates per donor per experiment. Bars show the means ± SD; P-values determined by Student t test (two-tailed, unpaired). *P < 0.05; **P < 0.01; ***P < 0.001; ****P < 0.0001.

