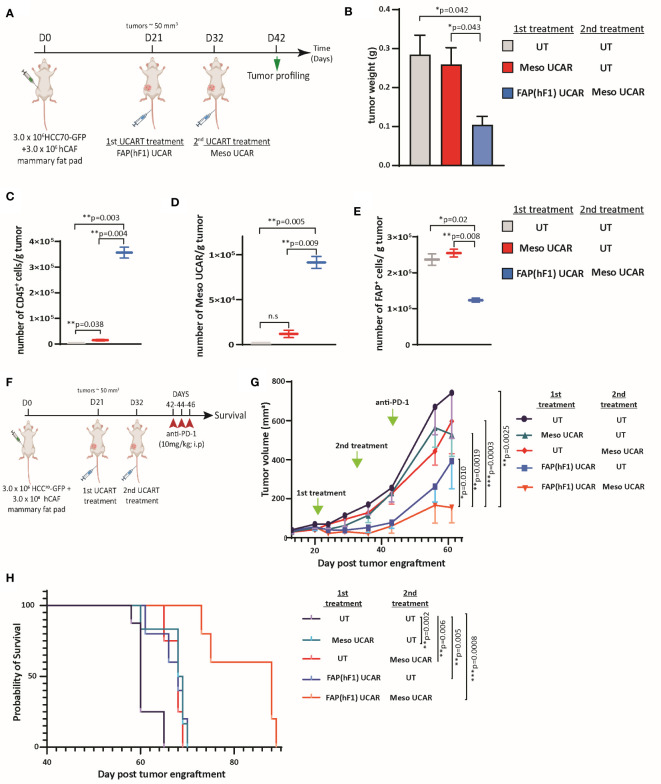
Figure 4.
FAP(hF1) UCAR T-cell pre-treatment sensitizes CAF+ cold tumors to Meso UCAR T-cell plus anti-PD-1 combination therapy (A) Schematic of sequential UCAR T-cell treatment and analysis of orthotopic TNBC tumors implanted in NSG mice. (B) Bar graph representing weights of tumor harvested from mice treated with control UT, FAP(hF1) UCAR, or FAP(hF1) UCAR and Meso UCAR T-cells combination as per schematic in (A). Bars show the means ± SEM; P-values determined by Student t test (two-tailed, unpaired), n=2. (C) Box and whiskers plot representing quantitation of total number of CD45+ cells per gram orthotopic TNBC tumors from mice treated with indicated UCAR T-cells, as determined by flow cytometry. P-values determined by Student t test (two-tailed, unpaired), n=2. (D) Box and whiskers plot representing quantitation of total number of Meso UCAR T-cells per gram orthotopic TNBC tumors from mice treated with indicated UCAR T-cells, as determined by flow cytometry. P-values determined by Student t test (two-tailed, unpaired), n=2. (E) Box and whiskers plot representing quantitation of total number of FAP+ cells per gram orthotopic TNBC tumors from mice treated with indicated UCAR T-cells, as determined by flow cytometry. P-values determined by Student t test (two-tailed, unpaired), n=2. (F) Schematic of sequential UCAR T-cell and anti-PD-1checkpoint inhibitor treatment and subsequent analysis of orthotopic TNBC tumor-implanted NSG mice. (G) Graph representing growth kinetics of orthotopic TNBC tumors in mice treated as indicated over time. P-values determined by Student t test (two-tailed, unpaired), n=5-8 mice per cohort. (H) Kaplan–Meier curve for survival analysis of orthotopic TNBC tumor-implanted NSG mice treated as indicated (n=5-8 per cohort). P-values determined by Log-Rank (Mantel-Cox) test. *P < 0.05; **P < 0.01; ***P < 0.001; ns, not significant.

