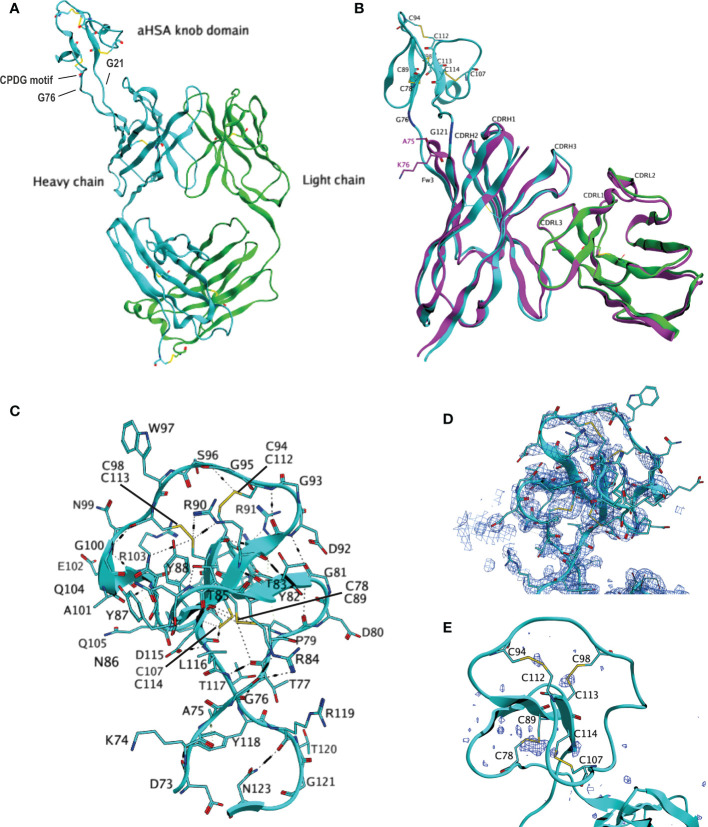
Figure 3.
Crystal structure of FabT-aHSA. (A) shows the crystal structure of FabT-aHSA. The heavy chain is shown in cyan, light chain in green. (B) shows the superposition of FabT-aHSA CDRs onto those of FabT, with the FabT-aHSA VH shown in cyan, VL in green and FabT VHVL in magenta. The electrostatic and disulfide bond interactions of the aHSA knob domain are shown in (C, D) shows a 2Fo-Fc electron-density map contoured at 1.0σ above mean for the aHSA knob domain. Correct building of the disulfide bond network was confirmed using sulfur-SAD, peaks of the anomalous difference map, contoured at 3.0σ above mean, are shown in dark blue in (E).

