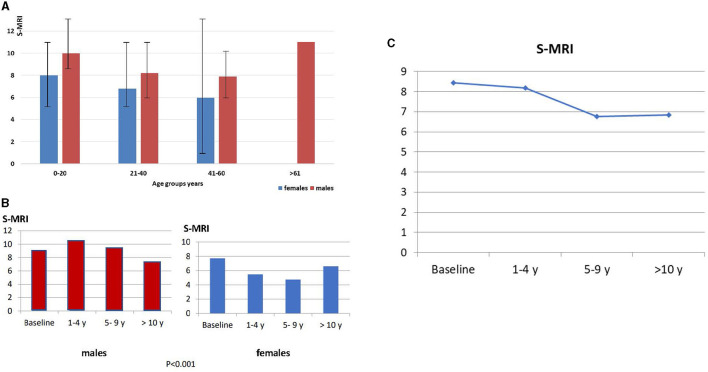
Figure 1.
(A) S-MRI distribution according to age group and gender. (B) S-MRI distribution in relation to sex. (B) At baseline, S-MRI in male patients is 9.1 vs. S-MRI in female patients is 7.7 (p < 0.001). After 10 years of follow-up, the mean S-MRI in male patients is 7.0 and mean S-MRI in female patients is 4.7 after 5–9 years of follow-up. (C) Globally, the S-MRI is 8.4, and the maximum reduction is observed after 5–9 years on therapy.

