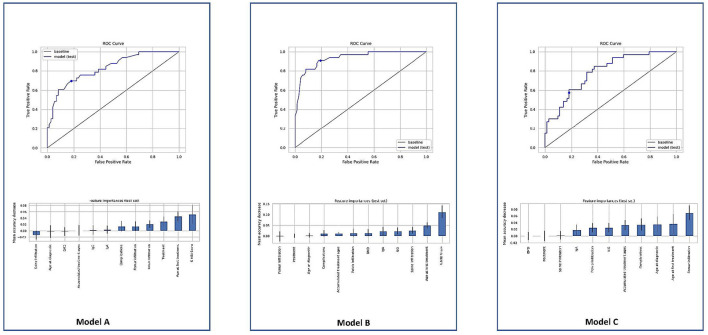
Figure 3.
ROC models. The point marks the decision boundary threshold of 0.5. A model includes all variables described as significant in a previous study. ROC B model considers whether any treatment was applied or not and features the importance of model B using the mean decrease in accuracy. ROC C model does not contain the S-MRI score and had a substantial drop in accuracy of 74.29% and an f1-score of 69.92%.

